
Figures & data
Table 1. Characteristics of the studied patients.
Figure 1. The –log10 P values for log-additive models of the association between polymorphisms in serotonin receptor genes and hyperprolactinaemia in patients with schizophrenia. For the rs6314 polymorphism, the log-additive model could not be calculated due to the messiness of homozygotes for the rare allele.
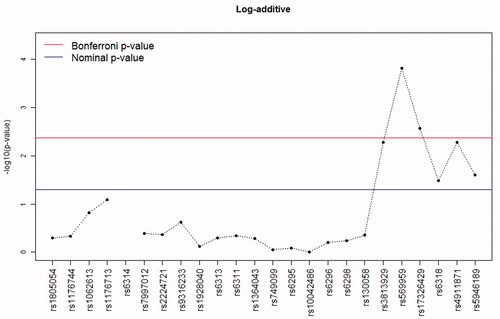
Table 2. Odds ratios (95% confidence interval) for the association between HPRL and X-chromosome markers applying the log-additive model in users of both first- and second-generation antipsychotics (FGA & SGA) compared to patients only using classical antipsychotics.
Table 3. Analysis of the association between HPRL and X-chromosome haplotypes in the total sample.
Supplemental material