Figures & data
Figure 1. Seed regions are depicted on the left side. The fronto-parietal network consisted of four seed regions, the cingulo-opercular network of three regions, and the the fronto-parietal network of on seed region (subgenual ACC). On the right side the connectivity from each network seed with the rest of the brain is displayed for each group separately.
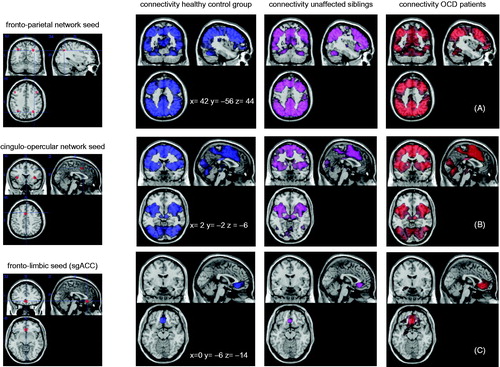
Table 1. Demographic and clinical characteristics of OCD patients and healthy controls.
Table 2. The matched group of OCD patients, unaffected siblings and healthy controls.
Table 3. Averaged (z transformed) correlation coefficients between the time courses of the seed maps of each network as a measure of within-network connectivity: t-test between average (z transformed) correlations for OCD patients and controls.
Table 4. Averaged (z transformed) correlation coefficients between the time courses of the seed maps of each network as a measure of within-network connectivity: ANOVA with average (z transformed) correlations for OCD patients, siblings and controls.
Table 5. Effect of group for network to whole-brain connectivity: two-group comparison (39 OCD patients and 36 healthy controls).
Table 6. Effect of group for network to whole-brain connectivity: three-group comparison (16 OCD patients, 16 unaffected siblings and 16 healthy controls).
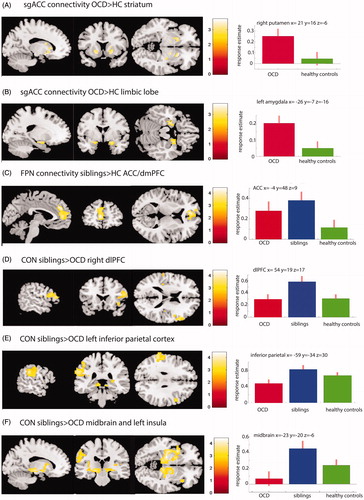
Figure 2. Group differences in network to whole-brain connectivity. (A and B) Areas with increased connectivity with the sgACC in OCD (n = 39) compared with healthy controls (n = 36). In (A) results are masked for the striatum and in (B) for the limbic lobe for illustration purpose and displayed at P < 0.005 uncorrected. (C) Increased connectivity between the FPN and the dACC/dmPFC in siblings vs healthy controls. (D, E, F) Increased connectivity in siblings vs OCD patients between the CON and the right dlPFC (D), the left inferior parietal cortex (E), and the midbrain areas, extending into the insular cortex (F). Plots on the right side show the response estimates for each group at the given coordinates.