Figures & data
Table 1. Demographic and clinical characteristics of the sample.
Figure 1. White matter alterations in CHR-P compared to CHR-NP (pFWE < 0.05). Global FA reductions in CHR-P comparing to CHR-NP appear to be explained both by FAT reductions and FW increases in CHR-P as there is a considerable overlap between significant clusters (left panels). Diffusion measures averaged across corresponding significant clusters are presented as boxplots on the right.
Note: CHR: clinical high-risk for psychosis, CHR-P: CHR individuals who developed psychosis, CHR-NP: CHR individuals who did not develop psychosis, FA: fractional anisotropy, FAT: fractional anisotropy of the tissue, FW: free-water
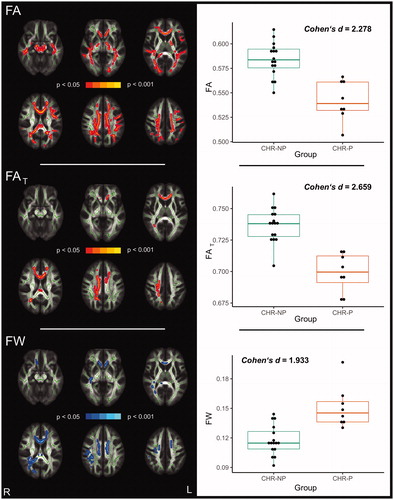
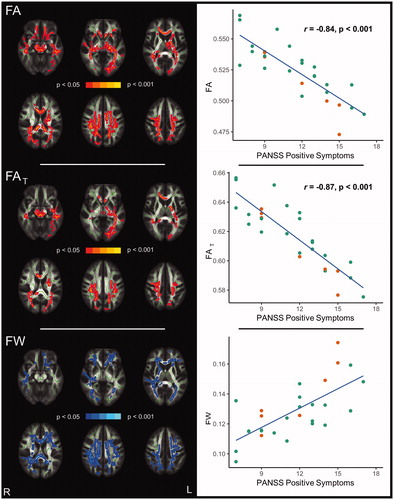
Figure 2. Correlations between positive symptoms and diffusion measures in CHR individuals (n = 28, pFWE < 0.05). FA and FAT (red) are inversely correlated, while FW (blue) is positively correlated with positive symptoms (left panels). Pearson’s correlations using diffusion measures averaged across corresponding significant clusters are shown on the right. Data points for CHR-P subjects are orange-coloured.
Note: CHR: clinical high-risk for psychosis, FA: fractional anisotropy, FAT: fractional anisotropy of the tissue, FW: free-water, PANSS: Positive and Negative Syndrome Scale