
Figures & data
Table 1. Clinical data and sequencing status from a repository cohort of 1,688 individuals sequenced from the Vietnam Era Twins Registry Biorepository.
Figure 1. Genome-wide identity by state (IBS) between twin pairs for a cohort of monozygotic, dizygotic, unrelated individuals, and technical replicate whole-genome sequences. Percent IBS for each twin pair, technical replicates, and randomly paired unrelated individuals is listed as a box plot. The centre and ends of the boxes represent the 25th, 50th and 75th percentiles of IBS values and the whiskers on each plot represent the range of IBS within 1.5 times the interquartile range of the lower and upper quartiles. Each individual IBS value is also plotted. Inset is a plot of genome-wide percent identity by state for monozygotic twins and technical replicates, respectively.
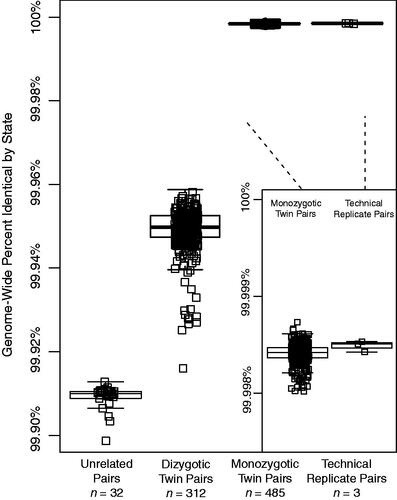
Figure 2. Regional displays of the BHLHE22 and SEZ6 loci and the single-variant associations at rs13279074 and rs117736100. (A) Variant associations to severe depression within the local region surrounding the BHLHE22 gene for rare non-silent variants (black border) as well common variants (no border). Shading of each circle is proportional to linkage disequilibrium, D‘ from the 1000 Genomes cohort. The size of the circle is proportional to Minor Allele Frequency. Recombination rate and overlapping gene models are also shown. Labeled loci are previously described common-variant associations to MDD and the variant of interest. (B) Gene structure display of BHLHE22 with protein domains and region annotation labelled. Two other previously-reported associated variants with phenotypes related to MDD are displayed. Expression data describing the tissue-specific expression profile of BHLHE22 is sourced from the Genotype-Tissue Expression project, most prevalent tissues are labelled. (C) Plot of variant associations to severe depression within the local region surrounding the SEZ6 gene. Labels and descriptions correspond to those seen in Figure 2A. (D) Gene structure display of SEZ6 with protein domains and region annotation labelled where available.
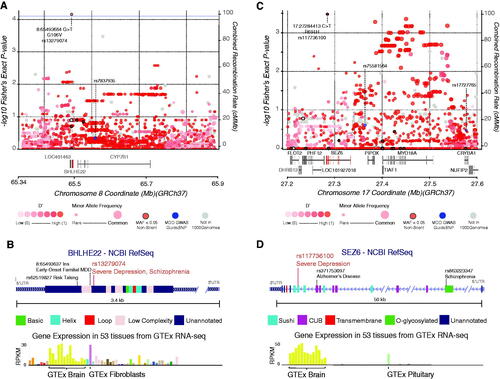
Table 2. Gene burden test and single variant results for the 102 previously associated regions for four depression phenotype variables.
Supplemental Table 3
Download MS Excel (43.6 KB)Supplemental Table 2
Download MS Excel (153.3 KB)Supplemental Table 1
Download MS Excel (14.6 KB)Supplementary Figures
Download MS Word (152.2 KB)Data availability statement
Investigators interested in accessing phenotypic and genotypic data from the VET Registry (https://www.seattle.eric.research.va.gov/VETR/Home.asp) can apply for data access by contacting the VET Registry at [email protected].