
Figures & data
Table 1. Description of depression symptoms and diagnosis criteria as per the DSM-IV.
Table 2. Descriptive statistics of demographic and depression measures in the NAKO.
Figure 1. Smoothed estimates of mean of Current (A) PHQ-9 and (B) PHQ-Stress Ratings and Frequency of Lifetime (C) NAKO MINI Classification and (D) Physician’s Diagnosis of Depression by Sex and Age. Note. The grey areas represent the 95% confidence interval. MINI = Mini-International Neuropsychiatric Interview. NAKO = German National Cohort. PHQ-9 = Depression Scale of the Patient Health Questionnaire (PHQ-9). Based on (NAKO data freeze 100,000; application NAKO-399).
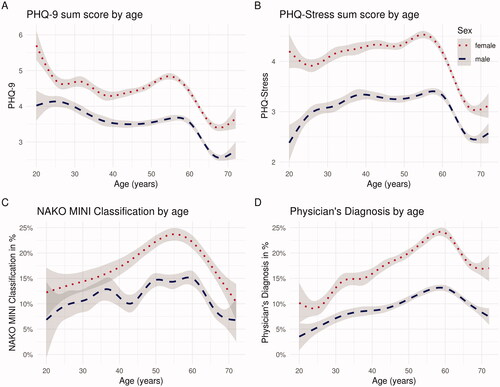
Table 3. Descriptive statistics of depression measures by Age Group in the NAKO.
Table 4. Descriptive statistics of depression measures by ISCED-97 education level in the NAKO.
Figure 2. Frequency of physician’s diagnosis of depression (lifetime), positive MINI screen (lifetime), and PHQ-9 ≥ 10 (4 weeks) by Study Centre. Note. MINI = Mini-International Neuropsychiatric Interview. NAKO = German National Cohort. PHQ-9 = Depression Scale of the Patient Health Questionnaire (PHQ-9). Based on (NAKO data freeze 100,000; application NAKO-399).
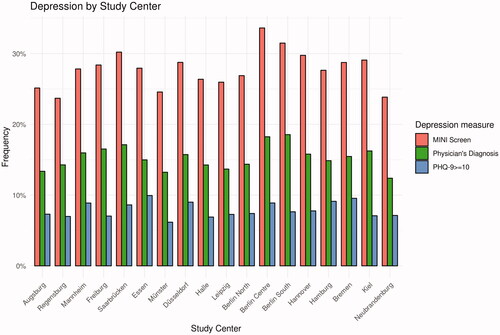
Figure 3. (A) Odds Ratio and 95% confidence interval for measures of depression by reported family history of depression. (B) Distribution of PHQ-9 and PHQ-stress mean scores and 95% confidence interval by Reported Family History of Depression in the NAKO. Note. Participants reporting no history of depression in their parents are presented as the reference group (blue). Estimates are adjusted for age, sex and education level (lower/intermediate/higher). MINI = Mini-International Neuropsychiatric Interview. NAKO = German National Cohort. PHQ-9 = Depression Scale of the Patient Health Questionnaire (PHQ-9). n = subjects with complete data included in the respective analysis. Based on (NAKO data freeze 100,000; application NAKO-399).
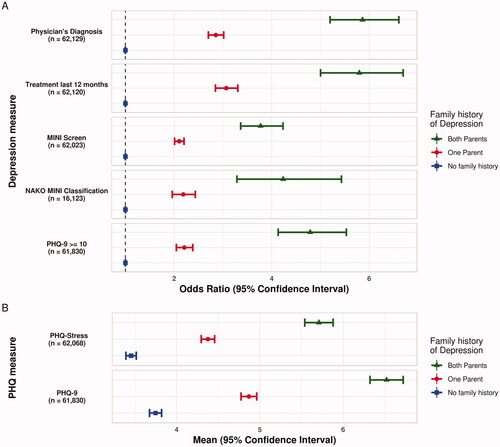
Table 5. Proportion of positive diagnosis or screening and mean of depression measures (columns) for participants negative or positive for the different categorical depression measures (rows) in the NAKO.