
Figures & data
Table 1. Characteristics of individual studies included in the meta-analysis.
Figure 1. The flow of information through the different stages of the selection of gene expression datasets for meta-analysis.
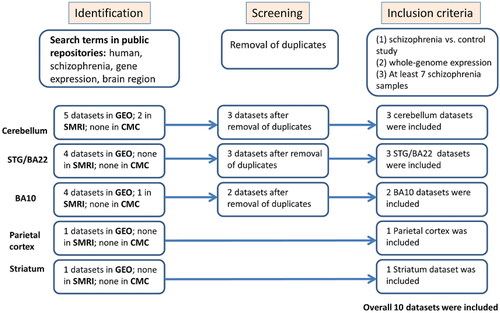
Table 2. Brain samples statistically significant MRPL and MRPS gene expression meta-analysis results.
Table 3. Blood samples statistically significant MRPL and MRPS gene expression meta-analysis results.
Figure 2. Meta-analysis of MRPL4 and MRPS7 differential expression in ten brain samples and two blood samples of individuals with schizophrenia vs. healthy controls. (A) Brain samples MRPL4 meta-analysis. A forest plot was generated using the function “forest” from the “meta” package in R, version 4.9–2 (General Package for Meta-Analysis) (Schwarzer Citation2007). Each square represents the standardised difference (Hedges’ g [Hedges Citation1981]) between schizophrenia and control for a specific dataset, with the area of the square reflecting the weight (determined by the sample size) given to that dataset in the meta-analysis. Each horizontal line represents the 95% confidence interval for the mean difference in that study. The vertical line shows the point of zero difference. The standardised difference is positive (negative) if the expression is higher (lower) in schizophrenia vs. the control group. The vertical dashed red line points at the centre of the diamond, which represents the overall difference across both studies, and its width represents a 95% confidence interval. (B) Blood samples MRPL4 meta-analysis. (C) Brain samples MRPS7 meta-analysis. (D) Blood samples MRPS7 meta-analysis.
![Figure 2. Meta-analysis of MRPL4 and MRPS7 differential expression in ten brain samples and two blood samples of individuals with schizophrenia vs. healthy controls. (A) Brain samples MRPL4 meta-analysis. A forest plot was generated using the function “forest” from the “meta” package in R, version 4.9–2 (General Package for Meta-Analysis) (Schwarzer Citation2007). Each square represents the standardised difference (Hedges’ g [Hedges Citation1981]) between schizophrenia and control for a specific dataset, with the area of the square reflecting the weight (determined by the sample size) given to that dataset in the meta-analysis. Each horizontal line represents the 95% confidence interval for the mean difference in that study. The vertical line shows the point of zero difference. The standardised difference is positive (negative) if the expression is higher (lower) in schizophrenia vs. the control group. The vertical dashed red line points at the centre of the diamond, which represents the overall difference across both studies, and its width represents a 95% confidence interval. (B) Blood samples MRPL4 meta-analysis. (C) Brain samples MRPS7 meta-analysis. (D) Blood samples MRPS7 meta-analysis.](/cms/asset/58f0a243-ece5-4af2-bbef-9049ddfe815a/iwbp_a_2211653_f0002_c.jpg)