Figures & data
Figure 1. General flowchart of application of the method; labels A,B,C,D are stages that group the steps involve for ease of tracking the steps involved.
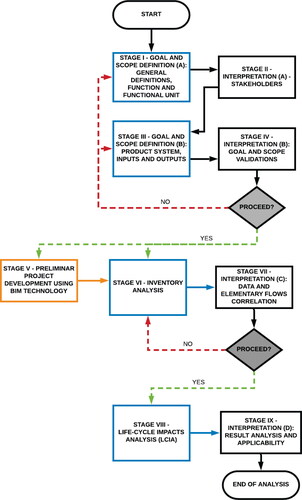
Figure 2. System boundary associated with Natural Gas Heating System.
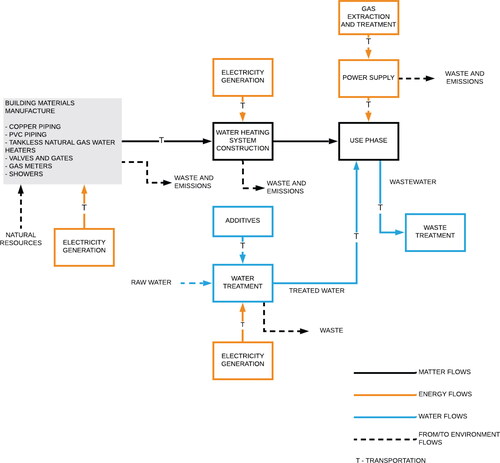
Figure 3. System boundary associated with SH and Electricity.
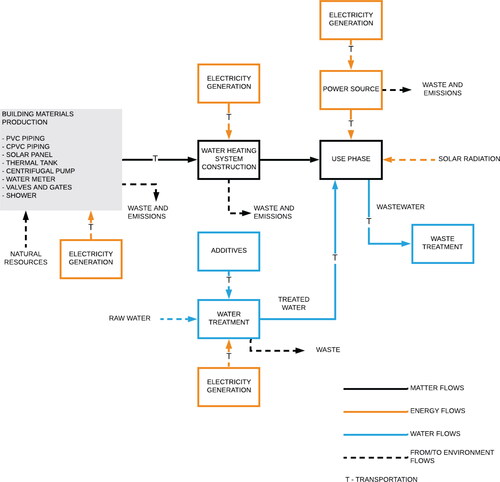
Figure 4. 3 D visulaisation and floor plan of the case study considered.
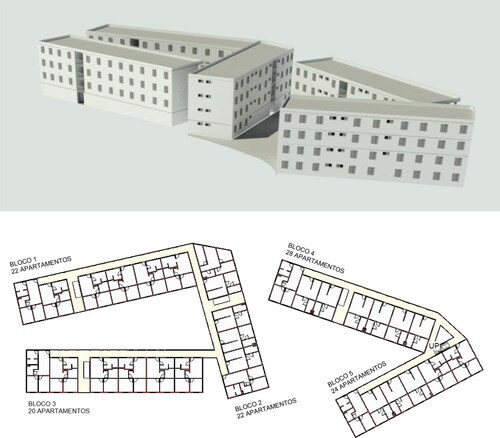
Figure 5. Flowchart of the project preparation process.
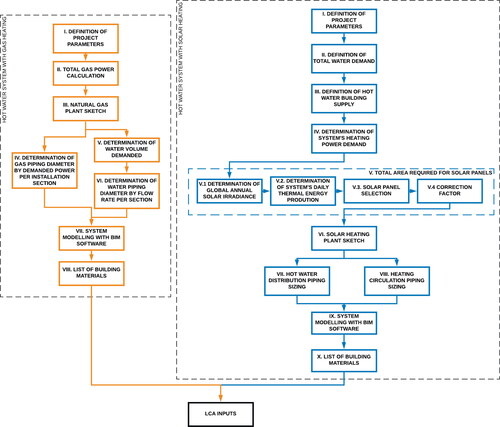
Table 1. Project preparation process for NG system.
Table 2. List of materials generated for NG water heating system using BIM.
Table 3. Project preparation process - HWBS with heating via SH.
Table 4. List of materials generated for SH water heating system using BIM.
Table 5. Summary of materials used in HWBS with heating via NG, consumption of raw materials and manufacturing processes.
Table 6. Summary materials used in HWBS with heating via SH, consumption of raw materials and manufacturing processes.
Table 7. Reference flows for the HWBS functional units obtained via list of materials of BIM modellations per shower unit.
Figure 6. Comparison of impacts related to damage to human health for HWBS via SH with electricity and HWBS via NG.
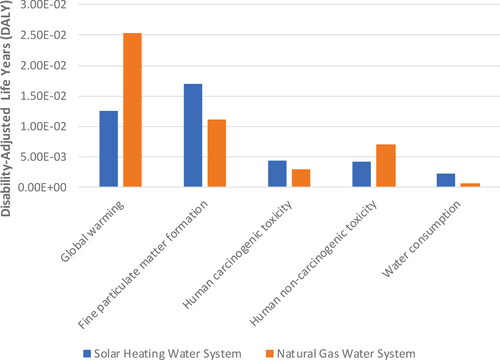
Figure 7. Comparison of impacts related to damage to ecosystems for HWBS via SH with electricity and HWBS via NG.
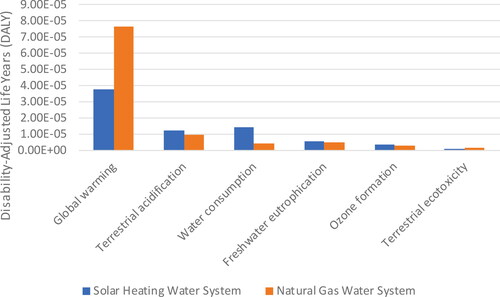
Figure 8. Environmental impacts related to HWBS via NG according to phases of the product system under study.
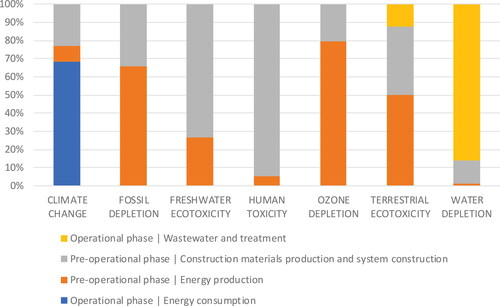
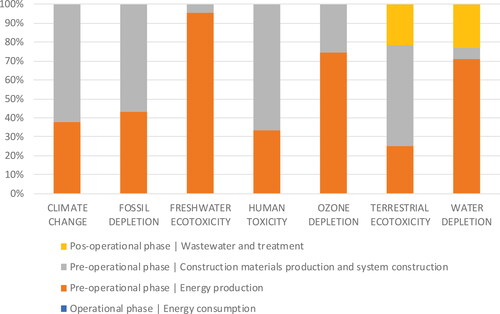
Figure 9. Environmental impacts of SH system, classified according to pre-operational, operational, and post-operational phases.