Figures & data
Table 1. Compositions of the composites.
Figure 1 XRD spectra of LLDPE, polybenzoxazine, and composites.
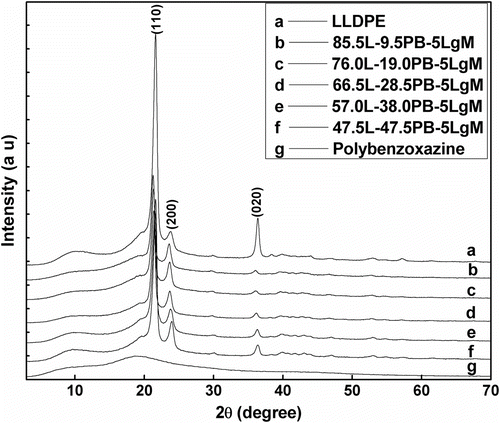
Table 2. Amount of crystallinity present in the prepared composites.
Figure 2 DSC thermogram of (a) benzoxazine, (b) LLDPE, and (c) 47.5L-47.5PB-5LgM composite.
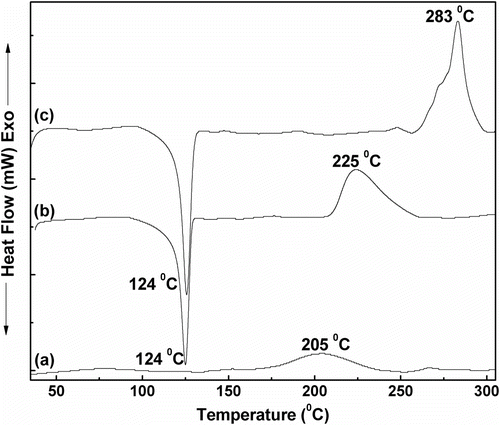
Table 3. Temperatures required for 5 and 10% weight loss due to thermal decomposition of the composites in air.
Figure 3 TGA thermograms of (a) LLDPE, (b) 57.0L-38.0PB-5LgM blend, (c) 47.5L-47.5PB-5LgM blend, and (d) polybenzoxazine.
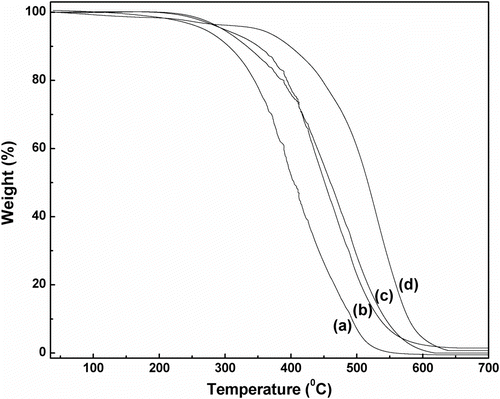
Figure 4 FTIR spectra of (a) benzoxazine monomer and (b) 47.5L-47.5PB-5LgM blend.
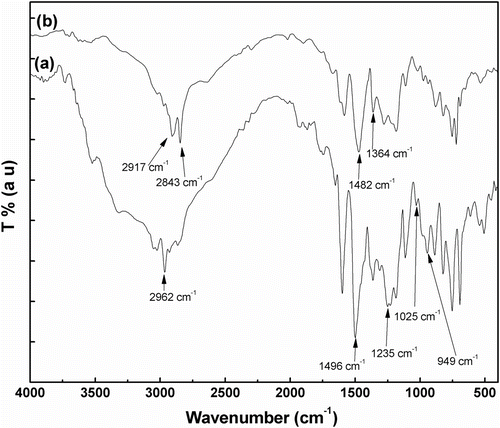
Figure 5 Change of tensile and flexural strength of the composites with the variation of LLDPE-g-MA in the composition.
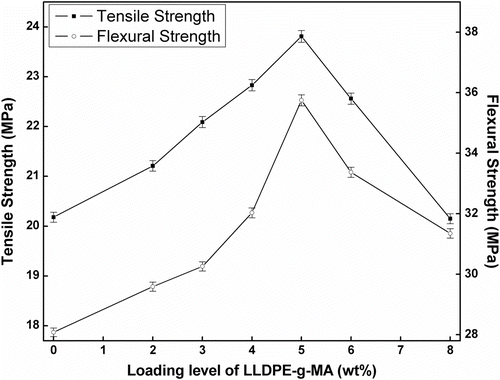
Figure 6 SEM micrograph of (a) 50.0L-50.0PB-0LgM blend, (b) 49.0L-49.0PB-2LgM blend, (c) 48.5L-48.5PB-3LgM blend, and (d) 47.5L-47.5PB-5LgM blend.
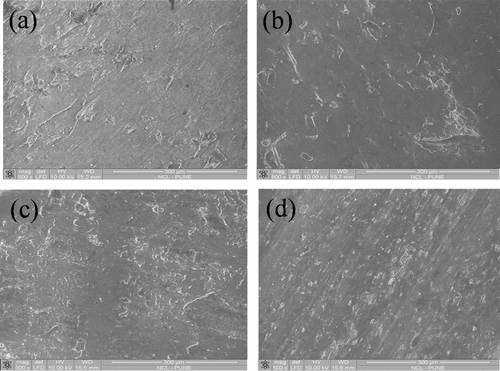
Table 4. Tensile and flexural properties of the composites having various amount of LLDPE-g-MA.
Figure 7 Tensile stress–strain curves of LLDPE–polybenzoxazine composites.
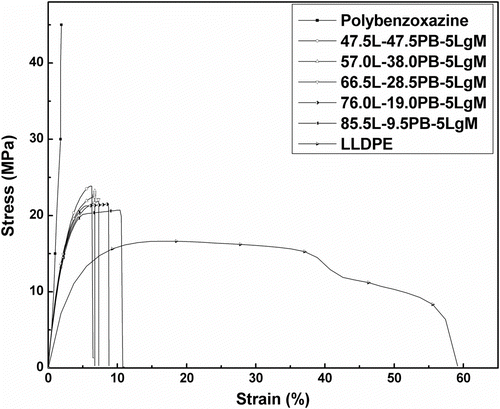
Figure 8 Flexural stress–strain curves of LLDPE–polybenzoxazine composites.
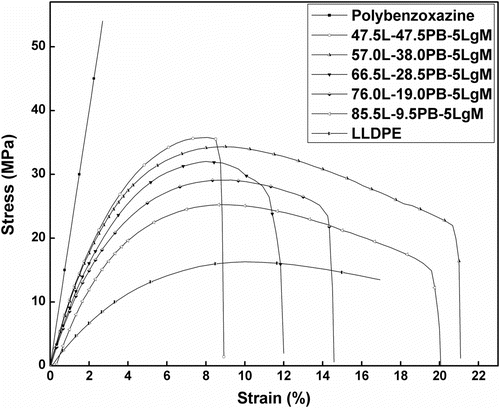
Table 5. Change of mechanical properties of the composites with the variation of LLDPE and polybenzoxazine in the composite.
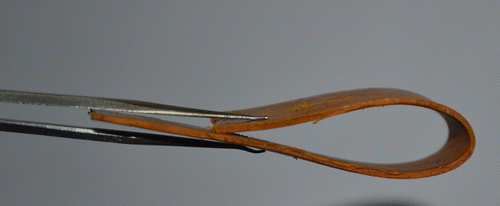
Figure 9 LLDPE–polybenzoxazine composite film (85 mm × 13 mm × 1 mm) showing mechanical flexibility.