704
Views
9
CrossRef citations to date
0
Altmetric
Articles

Fabrication and morphological characterizations of immobilized silver-loaded titanium dioxide nanoparticles/polyvinyl alcohol nanocomposites

, , &
Pages 349-357 | Received 28 May 2012, Published online: 04 Dec 2012

Figures & data

Table 1. Composition of PVA solution and AT/PVA mixtures.

Figure 1 Transmission electron micrograph showing a titanium dioxide NPs (gray structure) together with numerous supported silver NPs (dark spots).
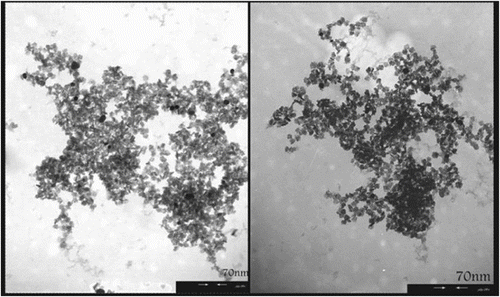
Figure 1 Transmission electron micrograph showing a titanium dioxide NPs (gray structure) together with numerous supported silver NPs (dark spots).

Scheme 1 Preparation of AT/PVA nanocomposite.

Scheme 1 Preparation of AT/PVA nanocomposite.

Figure 2 FT-IR spectra of PVA matrix (a), AT/PVA nanocomposite (N2) (b), AT/PVA nanocomposite (N3) (c), AT/PVA nanocomposite (N4), and (d), AT/PVA nanocomposite (N5) (d).
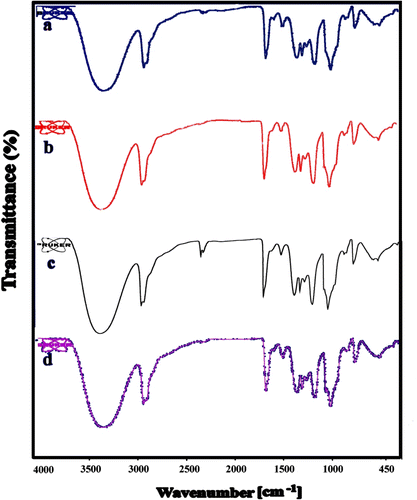
Figure 2 FT-IR spectra of PVA matrix (a), AT/PVA nanocomposite (N2) (b), AT/PVA nanocomposite (N3) (c), AT/PVA nanocomposite (N4), and (d), AT/PVA nanocomposite (N5) (d).

Figure 3 The two-dimensional AFM topography images of N3.

Figure 3 The two-dimensional AFM topography images of N3.

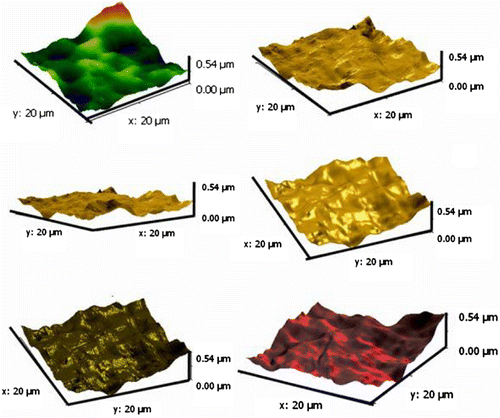
Figure 4 The three-dimensional AFM topography images of N3.

Figure 4 The three-dimensional AFM topography images of N3.

Figure 5 Selected zones from two-dimensional AFM image (a) and the height profiles related to measuring length (b).
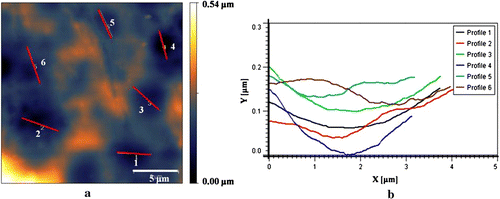
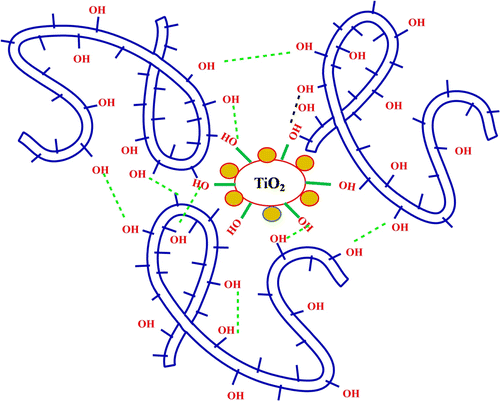
Figure 5 Selected zones from two-dimensional AFM image (a) and the height profiles related to measuring length (b).
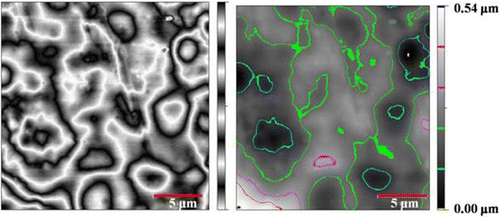
Table 2. Roughness parameters for AT/PVA nanocomposites.

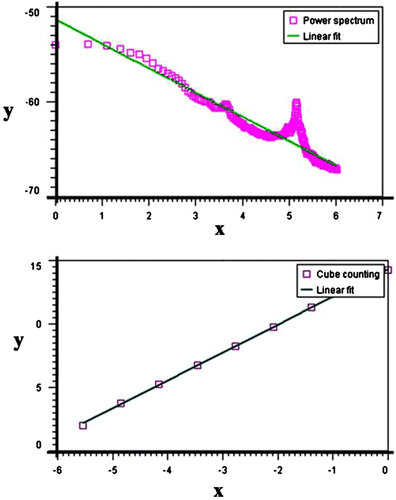
Figure 6 Fractal analysis of N3 nanocomposite by AFM.

Figure 6 Fractal analysis of N3 nanocomposite by AFM.

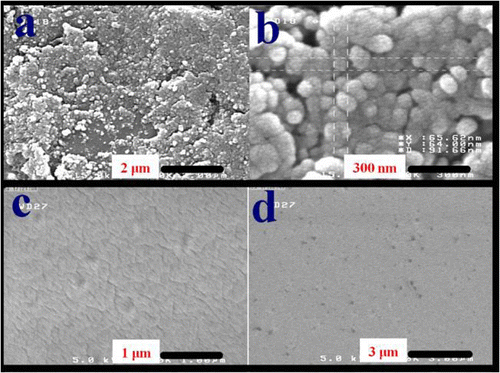
Figure 7 FE-SEM micrographs of AT nanostructures (a, b) and PVA matrix (c, d).

Figure 7 FE-SEM micrographs of AT nanostructures (a, b) and PVA matrix (c, d).

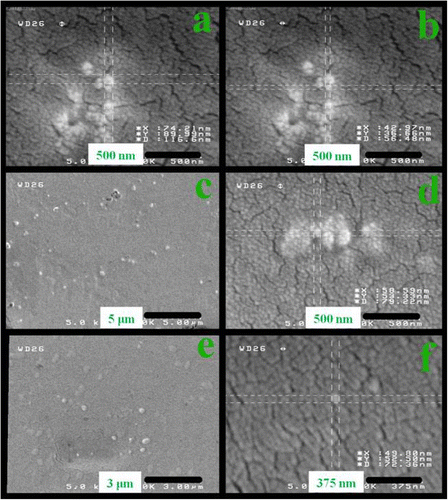
Figure 8 FE-SEM micrographs of AT/PVA nanocomposites N3 (a, b), N4 (c, d), and N5 (e, f).

Figure 8 FE-SEM micrographs of AT/PVA nanocomposites N3 (a, b), N4 (c, d), and N5 (e, f).

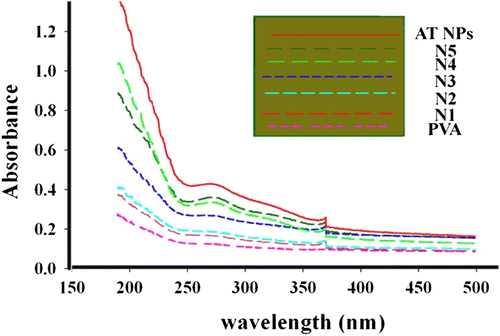
Figure 9 UV absorption spectra of the PVA and AT/PVA nanocomposite films.

Figure 9 UV absorption spectra of the PVA and AT/PVA nanocomposite films.

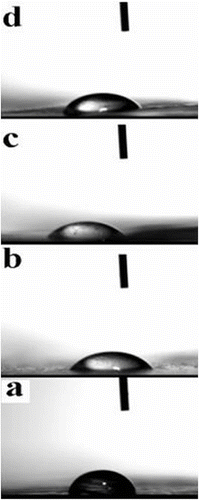
Figure 10 Contact angles of water droplets on the (a) PVA, (b) N2 nanocomposite, (c) N3 nanocomposite, and (d) N5 nanocomposite.

Figure 10 Contact angles of water droplets on the (a) PVA, (b) N2 nanocomposite, (c) N3 nanocomposite, and (d) N5 nanocomposite.

Reprints and Corporate Permissions

Please note: Selecting permissions does not provide access to the full text of the article, please see our help page How do I view content?

To request a reprint or corporate permissions for this article, please click on the relevant link below:

Academic Permissions

Please note: Selecting permissions does not provide access to the full text of the article, please see our help page How do I view content?

Obtain permissions instantly via Rightslink by clicking on the button below:

If you are unable to obtain permissions via Rightslink, please complete and submit this Permissions form. For more information, please visit our Permissions help page.