Figures & data
Table 1. Independent and dependent variables and constrains in box-behnken design.
Table 2. Composition of alginate raft forming tablets.
Table 3. Observed responses for alginate rafts forming tablets (n = 6).
Figure 1. 3D response surface graph showing effects of sodium alginate (X1), HPMC K100M (X2) and sodium bicarbonate (X3) on (A) % drug release at 2 h (Y2), (B) % drug release at 4 h (Y4) and (C) % drug release at 8 h (Y8).
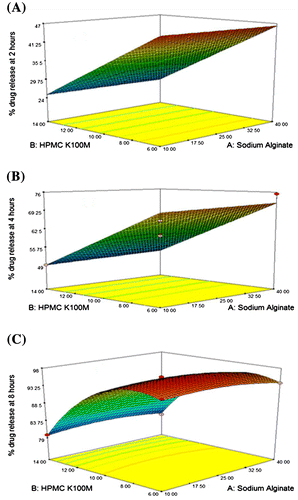
Table 4. Disintegration time of tablets and strength, weight, volume and thickness of raft (n = 6).
Table 5. Buffering capacity, neutralizing capacity, resilience, FLT and TFT of raft forming tablets (n = 6).
Figure 2. Drug release profile of pantoprazole sodium sesquihydrate from alginate rafts (n = 6).
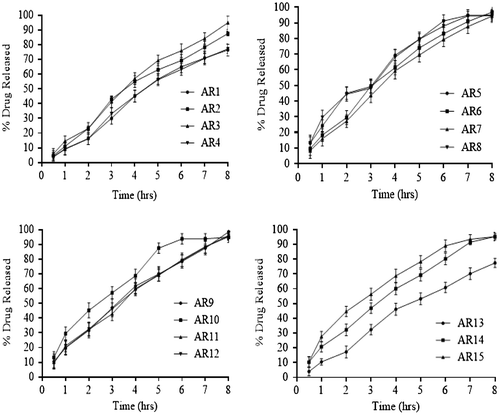
Figure 3. FTIR spectra of (A) PSS, (B) sodium alginate, (C) HPMC K100M and (D) alginate raft of optimized formulation AR9.
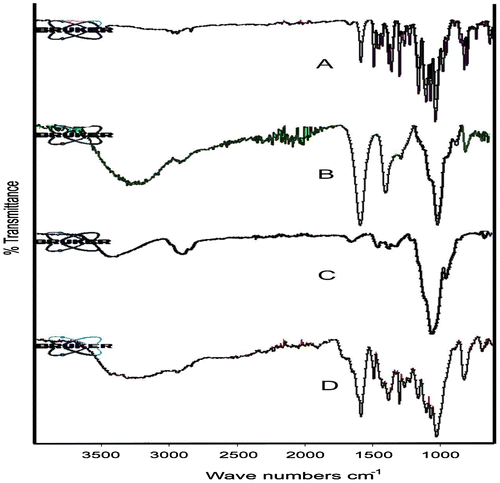
Figure 4. DSC thermograms of (A) PSS, (B) sodium alginate, (C) HPMC K100M and (D) tablet of optimized formulation AR9 and (E) alginate raft of optimized formulation AR9.
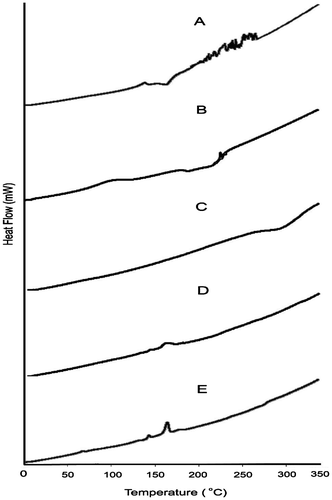
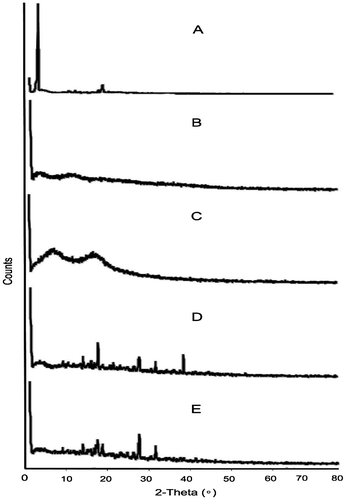
Figure 5. XRD of (A) PSS, (B) sodium alginate, (C) HPMC K100M and (D) tablet of optimized formulation AR9 and (E) alginate raft of optimized formulation AR9.