Figures & data
Figure 1. The graphical representation of different crosslinking methods.
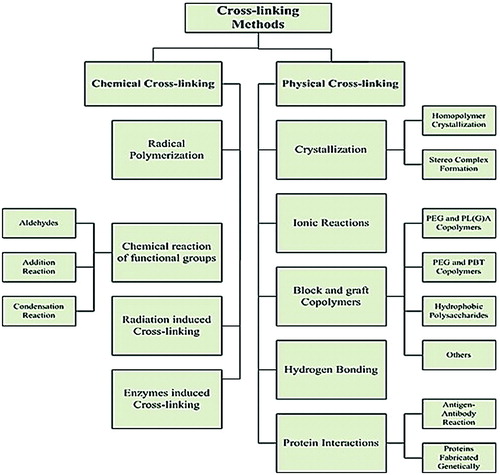
Figure 2. Chemical structure of captopril.
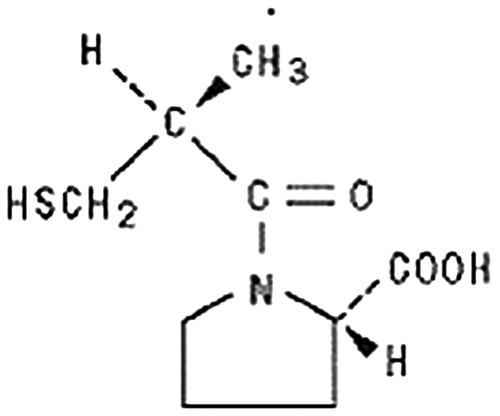
Table 1. Feed composition of different formulations of Ge/PVP based hydrogels.
Figure 3. Presumptive chemical structure of Ge/PVP based hydrogels.
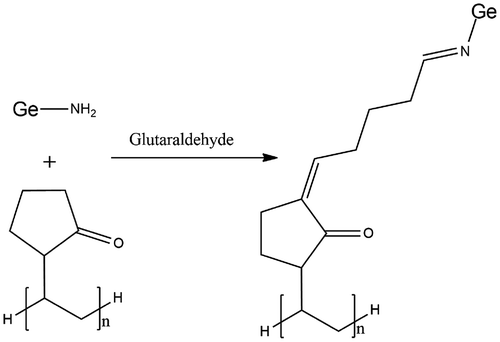
Figure 4. The schematic representation of acid base reactions in corresponding buffer media.
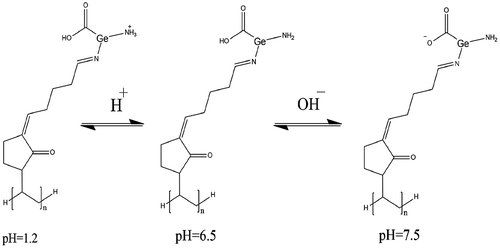
Table 2. Amount of captopril loaded in different samples of GE/PVP hydrogels.
Table 3. % Release of captopril from different samples of Ge/PVP hydrogels.
Figure 5. Equilibrium swelling ratio of Ge/PVP hydrogels with different concentrations of Ge using glutaraldehyde (GA) as crosslinking agent in solutions of different pH; pH 1.2 (□), pH 5.5 (●), pH 6.5 (♦) and pH 7.5 (▲).The data present the mean ± standard deviation of n = 3 individual readings.
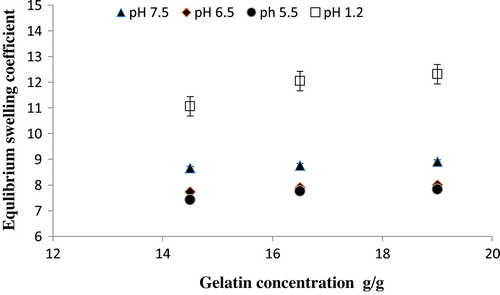
Figure 6. Equilibrium swelling ratio of Ge/PVP hydrogels having varying concentrations of PVP (3.5, 4 and 4.5 g) using GA as crosslinking agent (3.8 wt% of Ge and PVP) in solutions of different pH; pH 1.2 (□), pH 5.5 (●), pH 6.5 (♦) and pH 7.5 (▲).The data present the mean ± standard deviation of n = 3 individual readings.
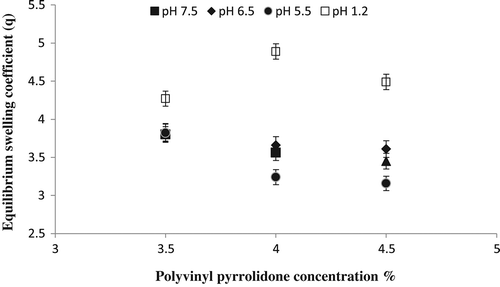
Figure 7. Equilibrium swelling ratio of Ge/PVP hydrogels having varying concentrations GA as crosslinking agent (3.5 wt%, 4 wt% and 4.2 wt% of Ge and PVP) in solutions of different pH; pH 1.2 (□), pH 5.5 (●), pH 6.5 (♦) and pH 7.5 (▲).
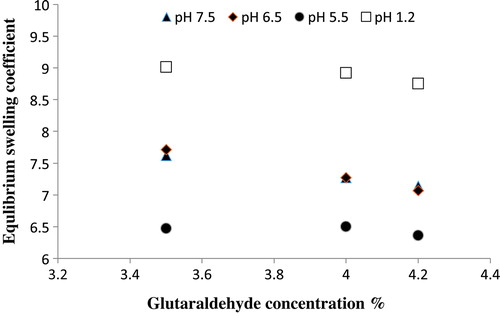
Figure 8. Cumulative % release of captopril from Ge/PVP hydrogels (A) Effect of variable concentration of Ge on % drug release in solution of different pH values (B) Effect of crosslinking agent concentration on % drug release in solution of different pH values. The data present the mean ± standard deviation of n = 3 individual readings.
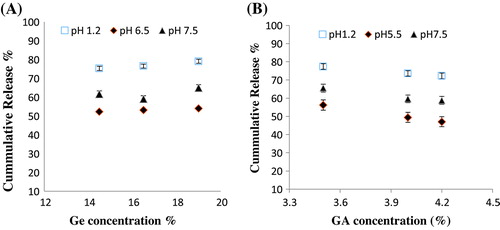
Table 4. Gel fraction of different formulation of Ge/PVP hydrogels.
Figure 9. Effect of processing variables on gel fraction of Ge/PVP hydrogels (A) Ge Concentration (B) PVP Concentration (C) GA Concentration, The data present the mean ± standard deviation of n = 3 individual readings.
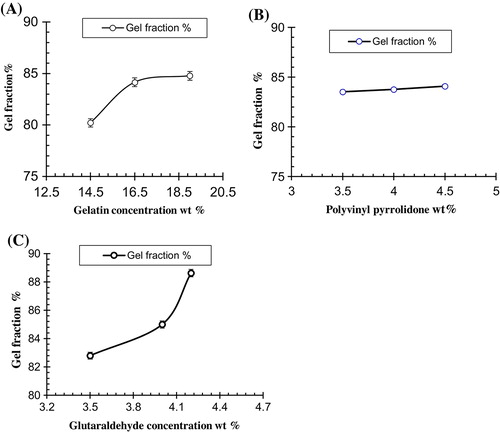
Table 5. Porosity of different formulations of Ge/PVP hydrogels.
Figure 10. Effect of processing variables on porosity of Ge/PVP hydrogels (A) Ge concentration (B) PVP concentration (C) GA concentration. The data present the mean ± standard deviation of n = 3 individual readings.
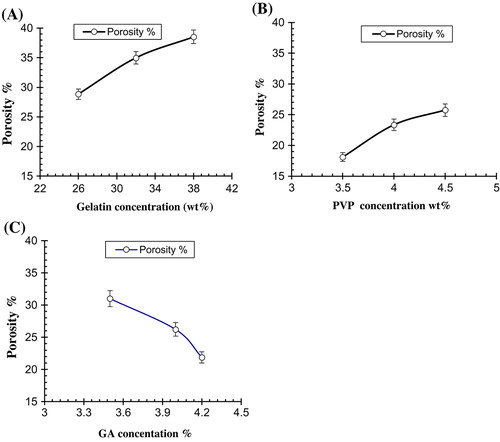
Table 6. Flory-Huggins network parameters of Ge/PVP hydrogels.
Table 7. Effect of Ge concentration on drug release kinetics of Ge/PVP hydrogels in different pH solutions using GA as crosslinker (3.8 wt% of Ge and Pec).
Table 8. Effect of Ge concentration on drug release mechanism of Ge/PVP hydrogels in different pH solutions using GA as crosslinker (3.8 wt% of Ge and Pec).
Table 9. Effect of concentration of crosslinker (GA) on drug release kinetics of Ge/PVP hydrogels in different pH solutions.
Table 10. Effect of concentration of crosslinker (GA) on drug release mechanism of Ge/PVP hydrogels in different pH solutions.
Figure 11. FT-IR spectra of (A) Gelatin (B) PVP (C) Unloaded hydrogel sample (D) Loaded hydrogel sample (E) Captopril.
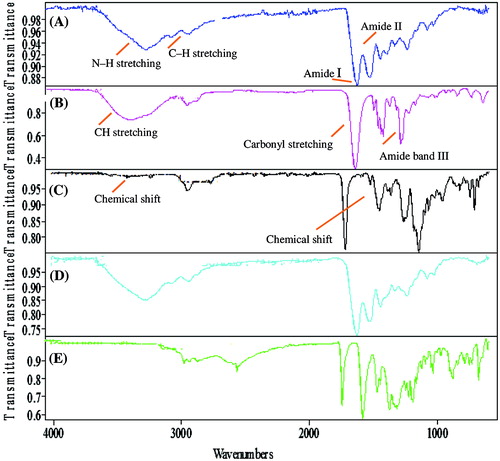
Figure 12. XRD spectra of (A) drug loaded Ge/PVP hydrogel sample (B) unloaded Ge/PVP hydrogel sample.
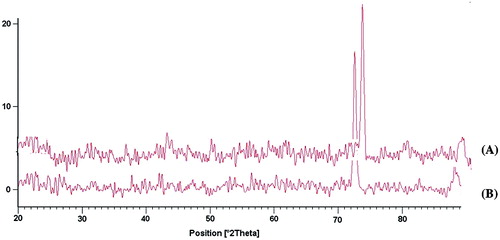
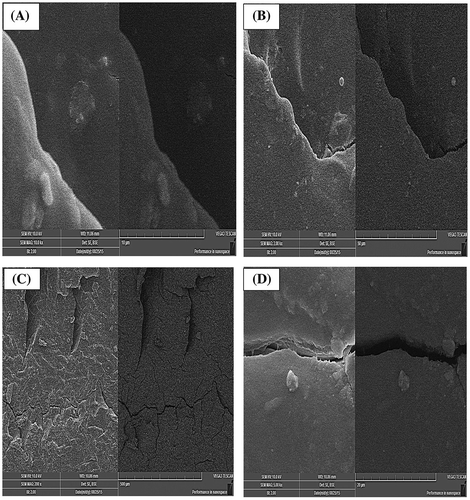
Figure 13. SEM analysis of Surface morphology of Ge/PVP hydrogel (A) Unloaded sample (B) loaded sample (C) Cross-sectional morphology of Unloaded Ge/PVP hydrogel sample (D) loaded Ge/PVP hydrogel sample.