Figures & data
Scheme 1. Structure of monomer M1.
Scheme 2. Synthesis of acidic monomer M1.
Table 1. Summary of kinetic characteristics for homopolymarization of monomer M1. Polymerizations in MeOH and dioxane initiated by AIBN.
Figure 1. Changes of the part of ATR-FTIR spectra of M1 during homopolymerization. 0.25 mol/L M1; 0.025 mol/L AIBN; MeOH; 60°C.
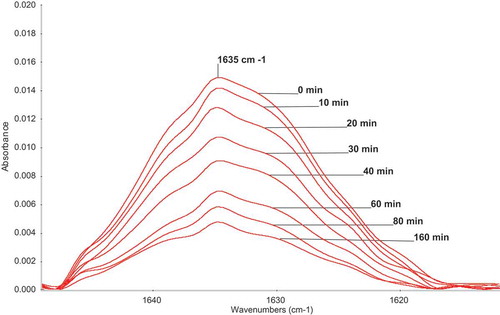
Figure 2. Monomer conversion of M1 during homopolymerization. [AIBN] = 0,05 mol/L, T = 60°C, MeOH.
![Figure 2. Monomer conversion of M1 during homopolymerization. [AIBN] = 0,05 mol/L, T = 60°C, MeOH.](/cms/asset/e66042f3-9258-4ceb-a777-a135bdbac66e/tdmp_a_1582216_f0002_b.gif)
Figure 3. Dependence of M1 initial polymerization rates on starting monomer concentrations in MeOH at 60°C; [AIBN] = 0.05 mol/L.
![Figure 3. Dependence of M1 initial polymerization rates on starting monomer concentrations in MeOH at 60°C; [AIBN] = 0.05 mol/L.](/cms/asset/3216f115-b903-4ac8-9f17-02c099dda072/tdmp_a_1582216_f0003_b.gif)
Figure 4. M1 initial polymerization rates in dependence on AIBN initiator concentrations (60°C; monomer concentration 0.5 mol/L; MeOH).
Figure 5. Monomer conversion of M1 during homopolymerization in dioxane. [AIBN] = 0,05 mol/L, T = 60°C.
![Figure 5. Monomer conversion of M1 during homopolymerization in dioxane. [AIBN] = 0,05 mol/L, T = 60°C.](/cms/asset/9cdb5427-aaa0-4067-9984-1c6a2ed332ef/tdmp_a_1582216_f0005_b.gif)
Figure 6. M1 initial polymerization rates in dependence on monomer concentration in the Arrhenius coordinates ([AIBN] = 0.05 mol/L, 60°C, dioxane).
![Figure 6. M1 initial polymerization rates in dependence on monomer concentration in the Arrhenius coordinates ([AIBN] = 0.05 mol/L, 60°C, dioxane).](/cms/asset/58047f04-43ff-4274-acca-a4547bfe0a05/tdmp_a_1582216_f0006_b.gif)
Figure 7. Details of the 1H-NMR spectra of the copolymerization of M1 with MMA at various time in deuterated methanol, T = 55°C. Molar ratio M1:MMA = 3.65:1 total monomers concentration = 0.5 mol/L, [AIBN] = 0.025 mol/L, CDCl3.
![Figure 7. Details of the 1H-NMR spectra of the copolymerization of M1 with MMA at various time in deuterated methanol, T = 55°C. Molar ratio M1:MMA = 3.65:1 total monomers concentration = 0.5 mol/L, [AIBN] = 0.025 mol/L, CDCl3.](/cms/asset/09398062-c769-4572-a3b4-ab8af6a1edcb/tdmp_a_1582216_f0007_b.gif)
Figure 8. (a) Monomer conversions of M1, MMA and total conversion during the copolymerization of mixture M1: MMA = 3.65:1. (b) comonomer ratio M1: MMA in feed versus time.
Figure 9. Jaacks plot obtained from time-conversion plot in .
Figure 10. Fineman–Ross plot for the free radical copolymerization of M1 and MMA.
Table 2. Reactivity ratio of M1 and MMA determined by different methods.
Figure 11. Instantaneous copolymer composition F1 versus commoner feed composition f1 of M1 in copolymerization with MMA; fit of the data points to r1 = rM1 and r2 = rMMA.