
Figures & data
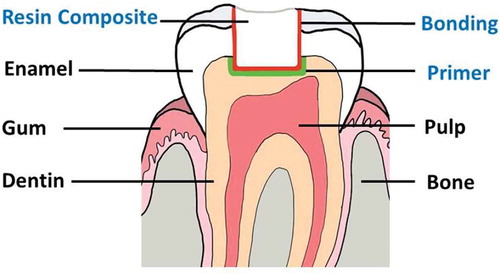
Figure 1. Illustration of the tooth and position of a primer, bonding, and resin composite.
Scheme 1. Hydrolysis reactions of HEMA and Bis-GMA.
Figure 2. Structures of antibacterial methacrylates: MDPB, DMAHM and DMADDM, methacrylamides: 5-NMSA, DEBAAP, monomer I and HMTAF.
Scheme 2. Synthesis of resin adhesive monomer HMTAF.
Scheme 3. Synthesis of reference monomer MDPB.
Figure 3. Citation1H NMR spectra of MDPB (a) before and (b) after treatment with aqueous hydrochloric acid (0.1 M, pH = 1).
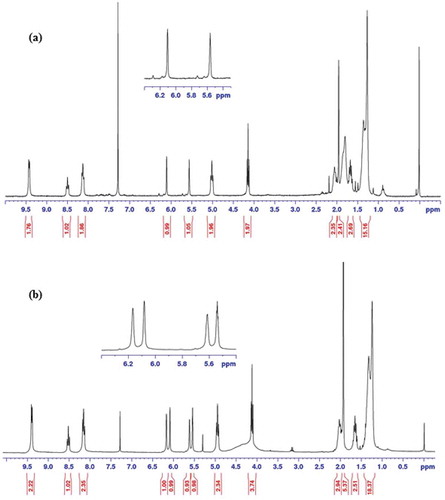
Scheme 4. Hydrolytic degradation reaction of MDPB in acidic condition.
Figure 4. FT-IR spectra of HMTAF (a) before and (b) after photopolymerization by curing with a halogen lamp.
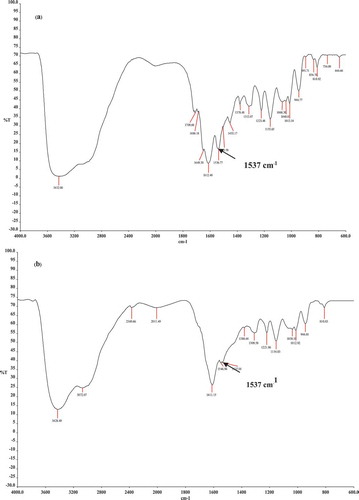
Figure 5. Plot of % cell viability vs concentration (µM) of HMTAF.
Supplemental material