Figures & data
Figure 1. Formation mechanism of P-containing monomer.
Figure 2. 1H-NMR spectrum of P-monomer and respective hydrogen resonances (600 MHz, CDCl3).
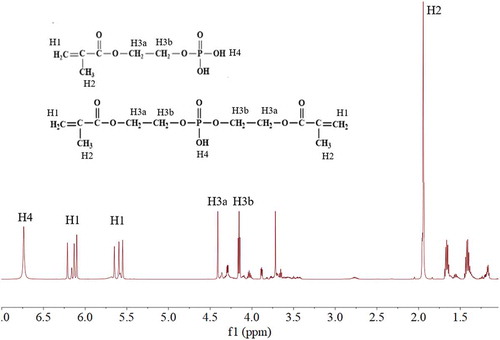
Table 1. Recipe of the prepared P-PSA emulsion.
Figure 3. FTIR spectra of PSA (a) and P-PSA (b) co-polymer.
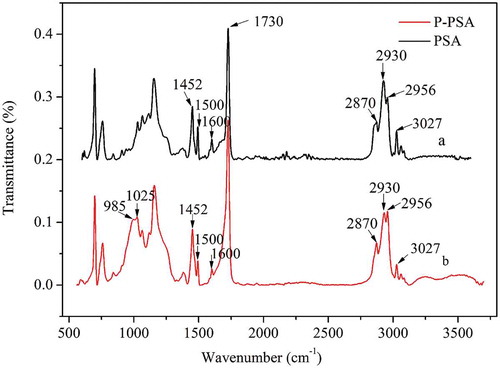
Table 2. Effects of P-monomer content on the prepared P-PSA emulsion.
Figure 4. TEM images of emulsions with different P-monomer contents: (a) 0, (b) 10%, (c) 20%, (d) 30% and (e) 40%.
Figure 5. TGA of P-PSA co-polymers with various P-monomer contents.
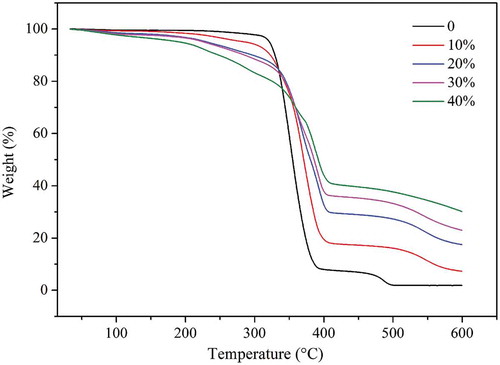
Table 3. Effects of P-monomer content on flame retardancy of P-PSA co-polymers.
Figure 6. Morphology and components of char residue of P-PSA co-polymer: (a) exterior and (b) interior.
Table 4. Element composition of P-PSA (30 wt% P-monomer) resin content before and after burning.
Figure 7. Energy spectrum before (a) and after (b) combustion of P-PSA co-polymer.