
Figures & data
Figure 1. Esterification of puerarin with succinic anhydride
Figure 2. HA and cross-linking reaction of ADH
Figure 3. HA-ADH and cross-linking reaction of PS
Figure 4. Puerarin standard curve using pH 6.8 PBS buffer as solvent
Figure 5. Puerarin standard curve using pH 7.4 PBS buffer as solvent
Figure 6. Puerarin standard curve using artificial gastric juice as solvent
Table 1. Relationship between the RGR value and cytotoxicity level
Table 2. Melting point determination results of puerarin and puerarin derivatives
Figure 7. UV-visible absorption spectra: (a) puerarin. (b) puerarin derivatives
Figure 8. FT-IR of puerarin and puerarin derivatives
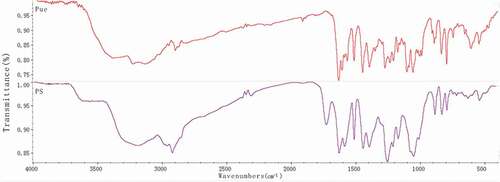
Figure 9. FT-IR of HA, Pue, HA-ADH and HA-ADH-PS
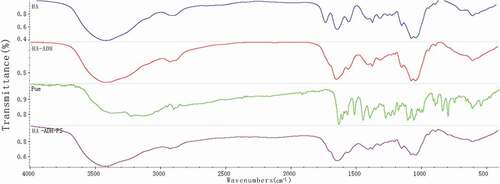
Figure 10. Thermogravimetric analysis (TG) and differential thermogravimetric analysis (DTG) curves for raw materials and HA-ADH-PS
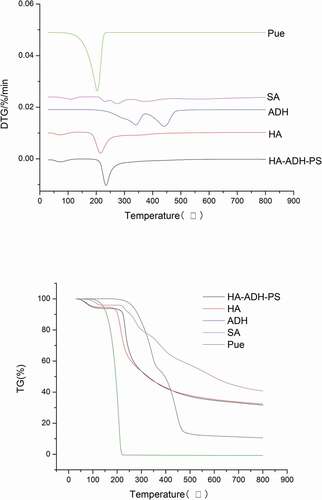
Figure 11. TEM images: (a) HA-ADH-PS nanomicelles; (b) Pue-loaded HA-ADH-PS nanomicelles
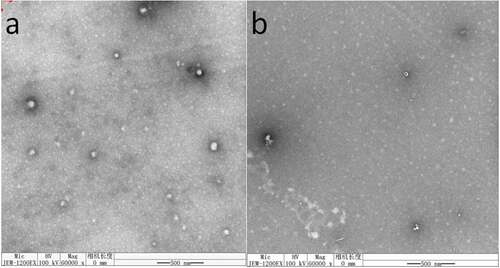
Figure 12. Particle size results: (a) HA-ADH-PS nanomicelles; (b) Pue-loaded HA-ADH-PS nanomicelles
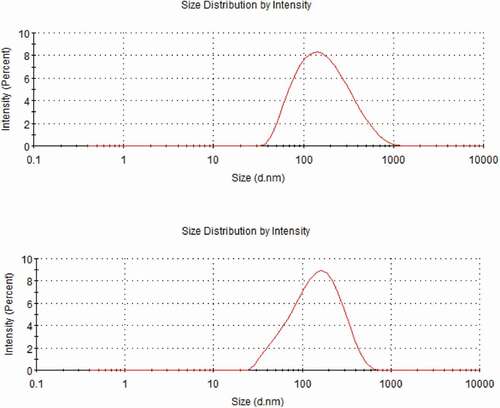
Table 3. Encapsulation efficiency and drug loading of Pue-loaded HA-ADH-PS nanomicelles
Figure 13. (a) Fluorescence emission spectra with increasing Pue-loaded HA-ADH-PS nanomicelles concentration; (b) Intensity ratio (I375/I395) plotted against Pue-loaded HA-ADH-PS nanomicelles concentration
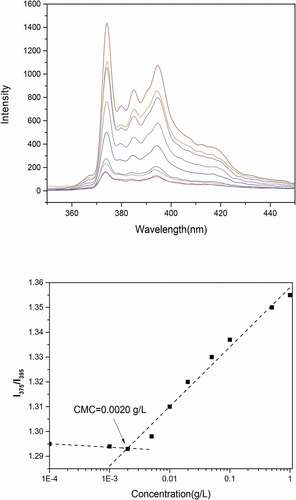
Figure 14. Cumulative release rate of Pue-loaded HA-ADH-PS nanomicelles at different acceleration times
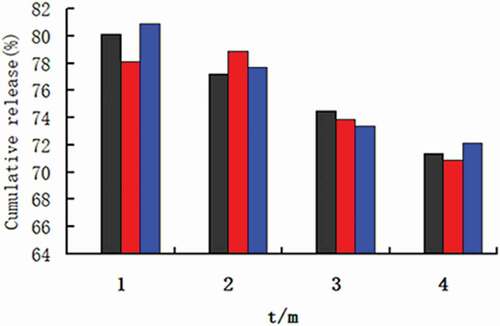
Figure 15. In vitro drug release profile of Pue-loaded HA-ADH-PS nanomicelles
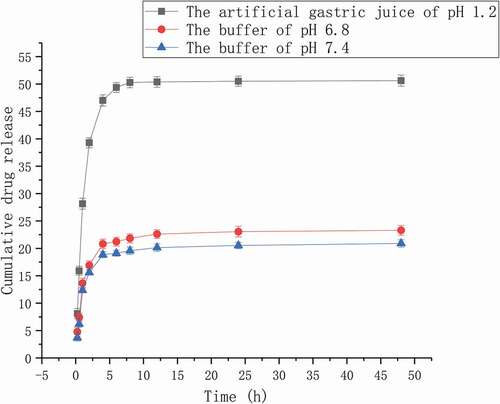
Figure 16. The DPPH radical scavenging activities of different concentrations of Pue-loaded HA-ADH-PS nanomicelles. All values are expressed as mean ± SD, * P < 0.05, **P < 0.01 vs Vc (n=6), P1, 15 µg/ml Pue-loaded HA-ADH-PS nanomicelles; P2, 30 µg/ml Pue-loaded HA-ADH-PS nanomicelles; P3, 60 µg/ml Pue-loaded HA-ADH-PS nanomicelles; Vc, 200 µg/ml vitamin C
Figure 17. Relative activity of L-929 cells after 24 h (A), 48 h (B), and72 h (C) culture with HA-ADH-PS nanomicelles solutions at different concentrations compared to the negative control. Data are presented as the mean士SD (n = 3)
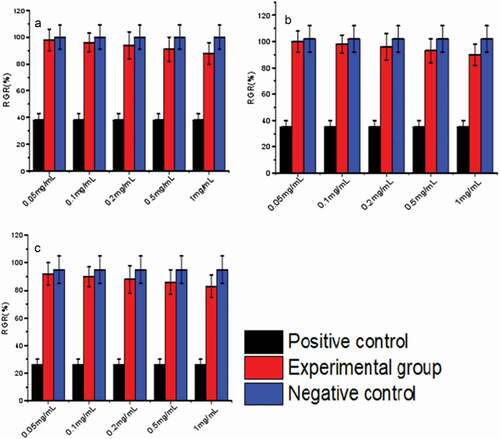
Table 4. RGR values of nanomicelles to L-929 cells during 72h of incubation, where Level represents cytotoxicity level