Figures & data
Figure 1. Changes in coating thickness and glass transition temperature over cure time
Figure 2. Coating thickness and micro characteristics at five points
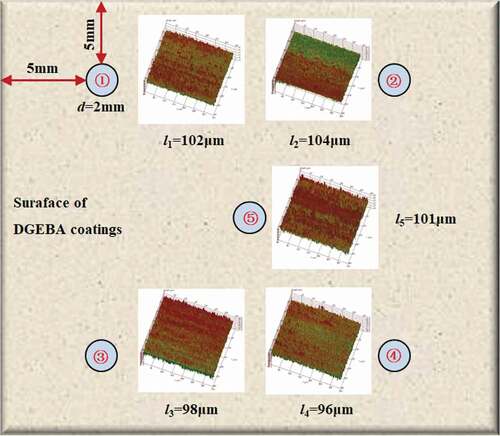
Figure 3. Adsorption test device at different temperatures
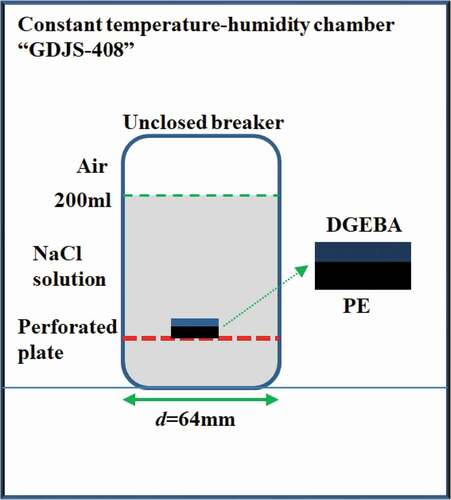
Figure 4. Experimental results of 3 wt.% NaCl solution diffusing in DGEBA coatings on PE base at different temperatures of 20 °C, 40 °C and 60 °C
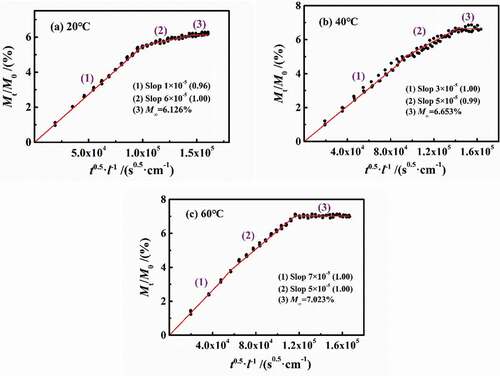
Figure 5. Fitted curves of immersion experiment at different temperatures
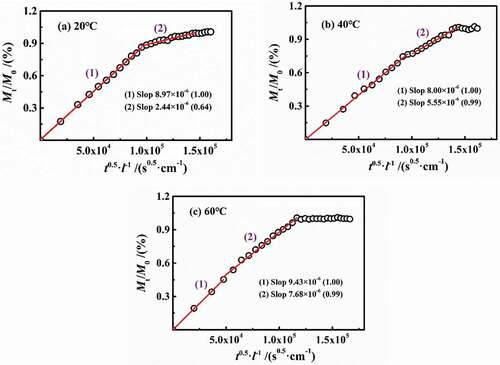
Figure 6. Diffusion coefficient (D) and experimental temperature (T) at different temperatures
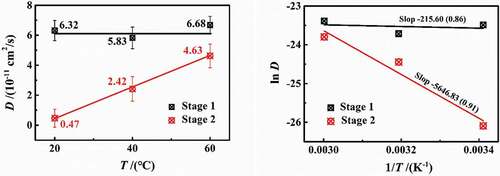
Figure 7. Changes in Mt/M0 in per 24 h vs. t0.5/l at different temperatures
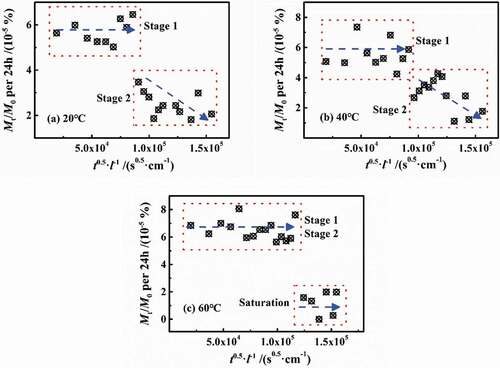
Figure 8. Changes in the swelling coefficient per 24 h named as SCm-t at different temperatures
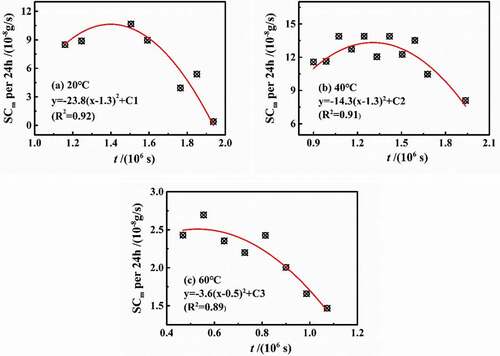
Figure 9. Determination of number of DGEBA molecules in per cell and the number of water molecules in saturation in per cell: (a) the change in the number of saturated water molecules in different DGEBA-molecule number per cell; (b) the number of saturated water molecules per cell containing 100 DGEBA molecules
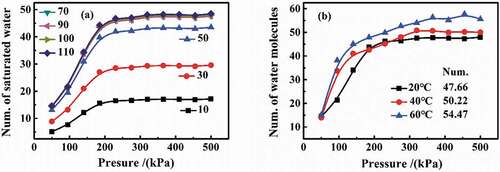
Table 1. Error analysis of numerical simulation
Figure 10. Changes in the related parameters at different temperatures
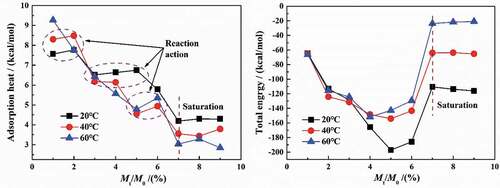
Figure 11. Water contents and diffusion time of initial diffusion stage at 20 °C and 40 °C
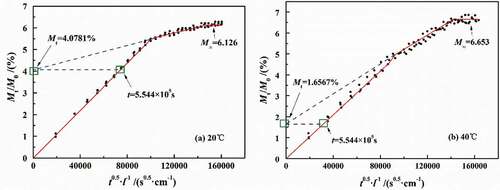
Figure 12. Experimental results of water molecule desorption from polymers on PE base
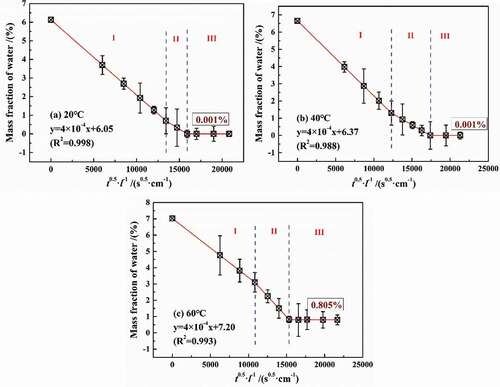
Figure 13. lgW-lg(P0/P) curves at different curves
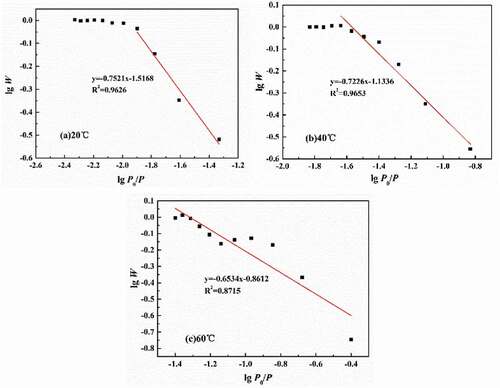
Figure 14. DSC results of the experimental samples at different temperatures
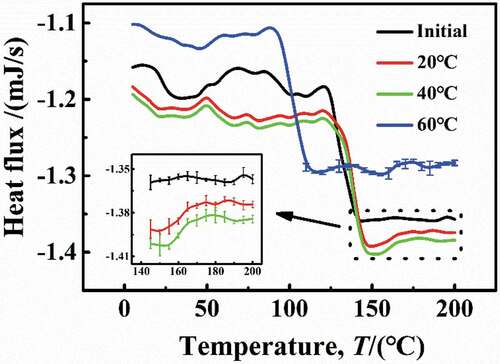
Figure 15. Results of Fourier infrared test of experimental samples at different temperatures
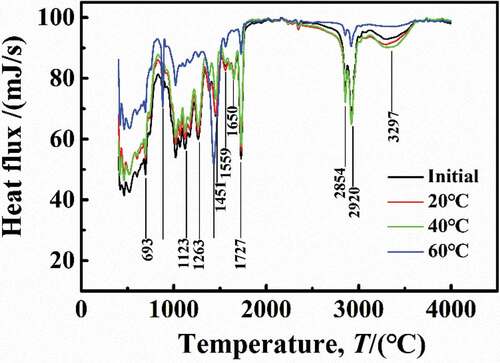
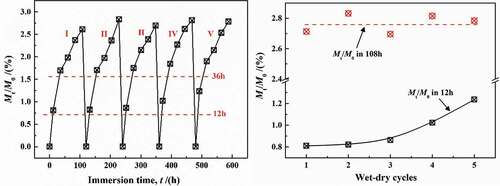
Figure 16. The relationship between water content in coatings with the number of adsorption-desorption cycles at 20 °C