Figures & data
Table 1. The compounds’ parameters of crystallography as well as the details of refinement
Figure 1. (a) The 1’s asymmetry unit. (b) The one-dimensional loop of [Co2(mbib)2] in complex 1. (c) The 1’s two-dimensional layered net. (d) The three-dimensional packing diagram of the complex 1.
![Figure 1. (a) The 1’s asymmetry unit. (b) The one-dimensional loop of [Co2(mbib)2] in complex 1. (c) The 1’s two-dimensional layered net. (d) The three-dimensional packing diagram of the complex 1.](/cms/asset/5bc50f03-099e-492f-bee7-ae40e62a764d/tdmp_a_1935535_f0001_oc.jpg)
Figure 2. (a) The asymmetry unit of complex 2. (b) The 2’s one-dimensional loop chain architecture. (c) The three-dimensional packing network of complex 2. (d) The interactions of π⋯π between the neighboring chains of the complex 2.
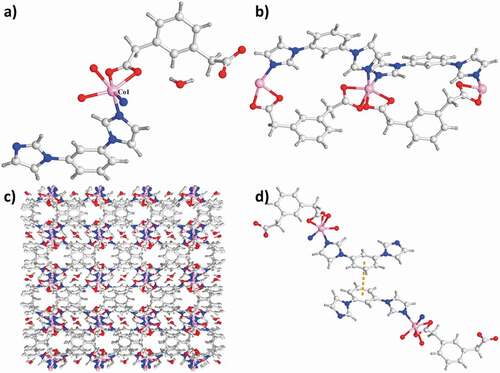
Figure 3. The PXRD models of complex 1 (a) and complex 2 (b). The TGA plot of complex 1 (c) and complex 2 (d)
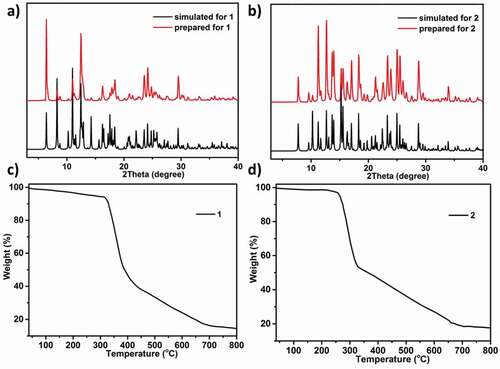
Figure 4. The temperature dependence of χM and and χMT for the complex 1 between 2 and 300 K (a); The 1/χM plot for 1 in 25–300 K (b). The red line indicates the best fit of Curie-Weiss
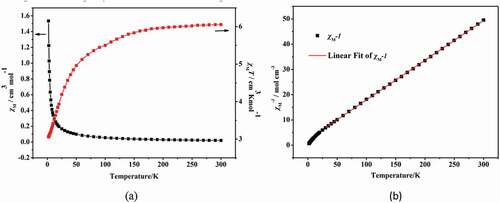
Figure 5. The temperature dependence of χM and χMT for the complex 2 from 2 K to 300 K (a); The 1/χM plot for 2 in 25–300 K (b). The red line indicates the best fit of Curie-Weiss
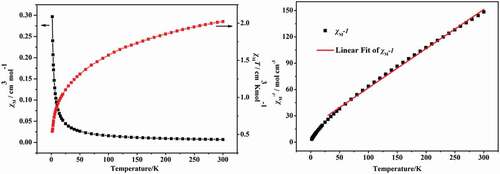
Figure 6. Compound 1 decreased the pro-inflammatory cytokines content in the hematoma capsule. Intracranial subdural space was injected with the autologous venous blood every two 3-day intervals, the injection of compounds were carried out for the treatment (at 2.5 μg/kg concentration). The enzyme-linked immunosorbent assay detection kit was employed for the pro-inflammatory cytokines determination in the hematoma capsule
Figure 7. Compound enhanced the levels of anti-inflammatory cytokines in the hematoma capsule. Intracranial subdural space was injected with the autologous venous blood every two 3-day intervals, the injection of compounds were performed for the treatment (with 2.5 μg/kg concentration). In the hematoma capsule, the content of IL-10 was determined via applying the enzyme-linked immunosorbent assay detection kit
Figure 8. Both compounds 1 and 2 has no cytotoxicity on the normal human cells. The normal human cells in the logical growth phage were collected and seeded into the 96 well plates. Then, compounds 1 and 2 was added for treatment with serial different dilutions (1, 2, 4, 8, 10, 20, 40 and 80 μM). The viability of the normal human cells was determined with CCK-8 detection