Figures & data
Figure 1. Schematic for the preparation of PS particles/rGO composites and corresponding composite sheets.
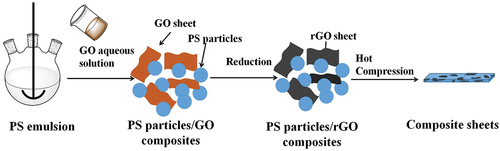
Figure 2. FTIR spectra of (a) GO, (b) rGO, (c) PS particles and (d) PS particles/rGO composites.
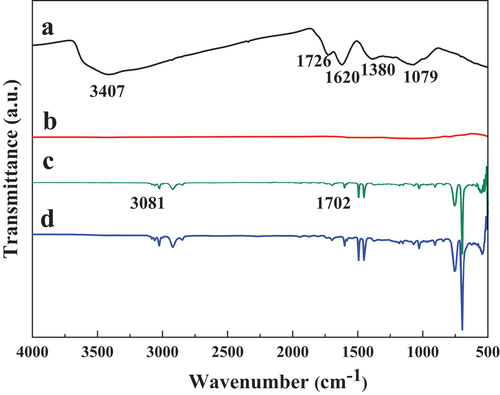
Figure 3. XRD patterns of (a) GO, (b) rGO and (c) PS/rGO composites.
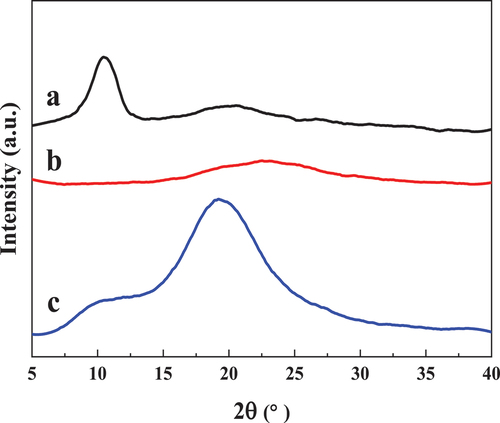
Figure 4. SEM image of (a) GO and (b) PS particles, and (c) diameter distribution of PS particles.
Figure 5. SEM images of PS/rGO composites before compression molding (a) 0.12 vol% rGO, (b) 0.46 vol% rGO and (c) 1.22 vol% rGO, and the corresponding cross sectional SEM images (d), (e), (f) after compression molding.
Figure 6. Frequency dependence of conductivity of the PS/rGO composites with different rGO content at room temperature.
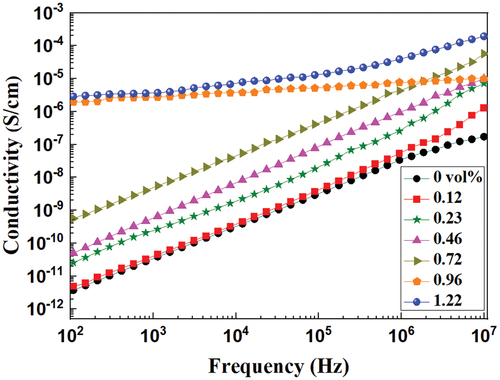
Figure 7. Frequency dependence of (a) dielectric permittivity and (b) loss factor of the PS/rGO composites with different rGO content at room temperature.
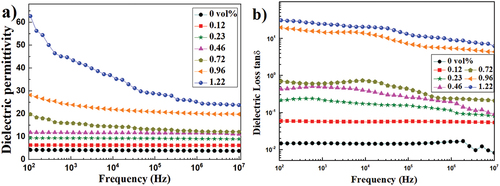
Figure 8. Weibull plot for DC breakdown strength of the PS/rGO composites with different rGO content at room temperature.
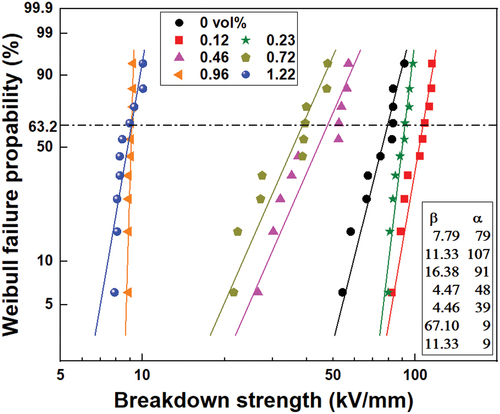
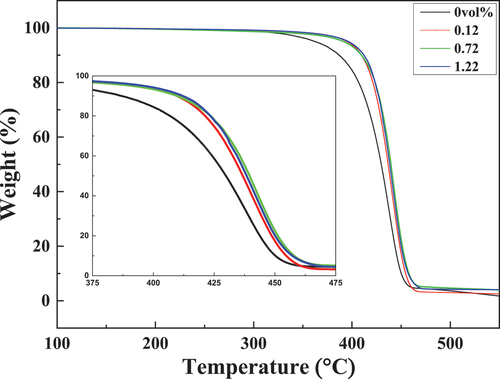
Figure 9. TGA curves of the PS/rGO composites with different rGO content.