Figures & data
Figure 1. TEM images of PANI synthesized in the absence (a–d) and presence (e–h) of D-CSA under the different inorganic salts: (a, e) no salts; (b, f) NaCl; (c, g) MgSO4 and (d, h) AlCl3.
Figure 2. UV-vis spectra of PANI synthesized in the absence (a) and presence (b) of D-CSA.
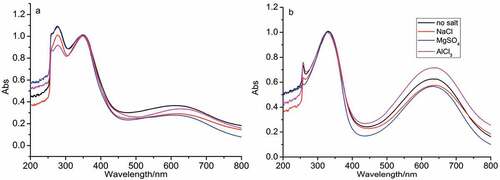
Figure 3. FTIR spectra of PANI synthesized in the absence (a) and presence (b) of D-CSA.
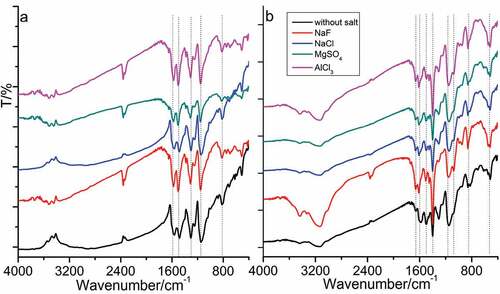
Figure 4. TEM images of PANI prepared at 5°C (a–d) and 25°C (e–h) at different concentration of NaCl: (a, e) 0 M; (b, f) 0.2 M; (c, g) 0.4 M and (d, h) 0.6 M NaCl.
Figure 5. UV-vis spectra of PANI prepared at different concentration of NaCl at 5°C (a) and 25°C (b), and [NaCl] = 0; 0.2; 0.4 and 0.6 M.
![Figure 5. UV-vis spectra of PANI prepared at different concentration of NaCl at 5°C (a) and 25°C (b), and [NaCl] = 0; 0.2; 0.4 and 0.6 M.](/cms/asset/14d43cd1-52c4-4aa1-b4cf-9ca20c608201/tdmp_a_2166727_f0005_oc.jpg)
Figure 6. In situ UV-vis spectra of PANI prepared at 0.2 M NaCl at 5°C.
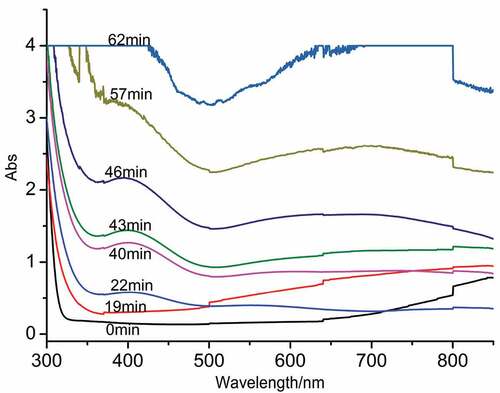
Figure 7. In situ 1H NMR spectra of PANI prepared in the micelle-like system composed of aniline and D-CSA at 5°C and the signal of D2O located at 4.87 ppm, a) the initiation stage after the addition of APS; b) the formative stage of phenazine structure; c) the separation of D-CSA from the micelle-like structure.
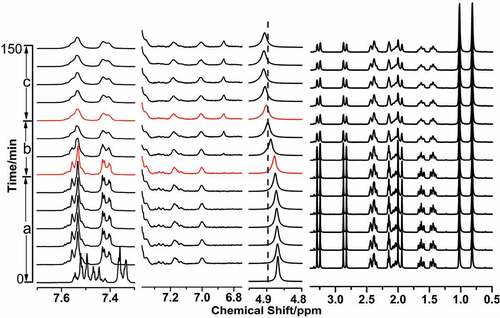
Figure 8. In situ 1H NMR spectra of PANI prepared in the micelle-like system containing 0.2 M NaCl at 5°C and the signal of D2O located at 4.84 ppm, a) the initiation stage after the addition of APS; b) the formative stage of phenazine structure; c) the reaction of aniline in micelle-like through outward diffusion.
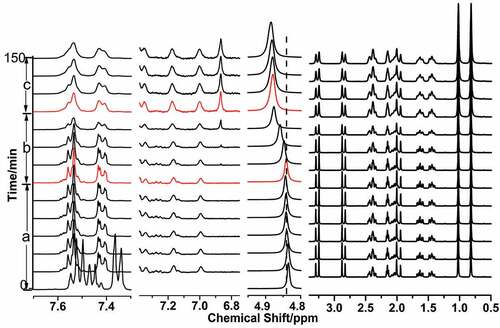
Figure 9. Cyclic Voltammograms of PANI prepared at the different conditions in 1.0 M H2SO4 at a scan rate of 5 mV−1 (vs. Saturated calomel electrode (SCE)): (a) no salt; (b) NaCl; (c) MgSO4 and (d) AlCl3.
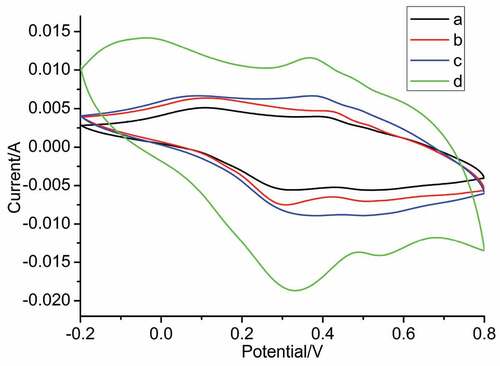
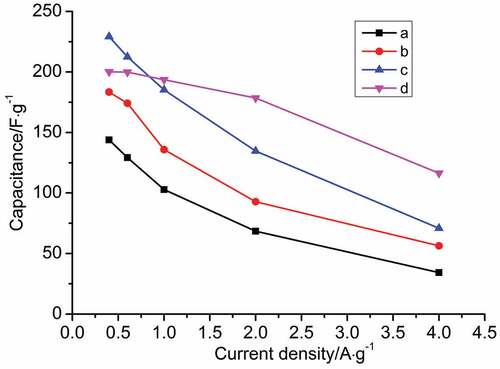
Figure 10. Specific capacitances of PANI as a function of current density prepared under the different conditions: (a) no salt; (b) NaCl; (c) MgSO4 and (d) AlCl3.