
Figures & data
Table 1. Composition of CMC/PVP/CuO NPs nanocomposite samples.
Figure 1. XRPD patterns of CMC/PVP blend (NC1) and its CuO NPs nanocomposites (NC2-NC6).
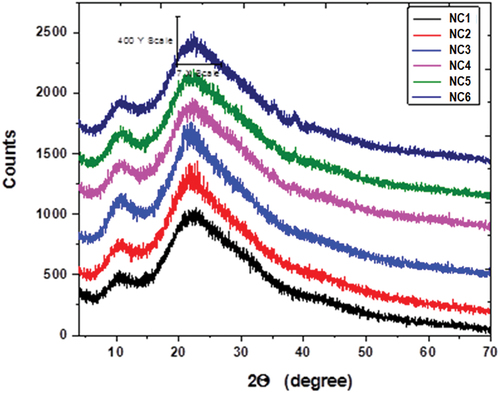
Table 2. The intensity (I) and full width at half maximum (FWHM) of the samples.
Figure 2. TEM image of CuO NPs prepared by laser ablation.
Table 3. Summary of TEM image analysis by ImageJ software.
Table 4. Surface roughness parameters of NC1, NC2, NC4, NC6 and its parent polymers.
Figure 3. SEM images of selected nanocomposites CMC, PVP, NC1, NC2 and NC4.
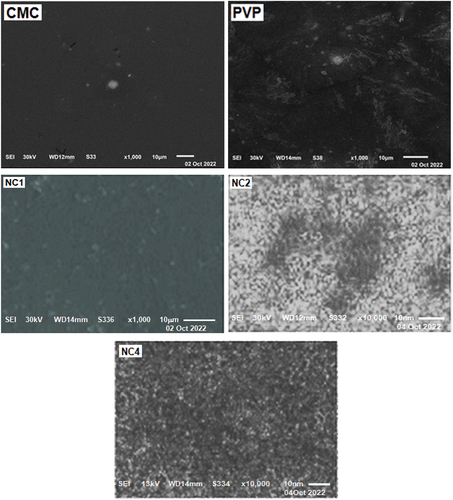
Figure 4. FTIR Spectra of (a) PVP, (b) CMC, and (c) CMC/PVP blend (NC1).
Figure 5. FTIR spectra of CMC/PVP blend (NC1) and its CuO NPs nanocomposites (NC2-NC6).
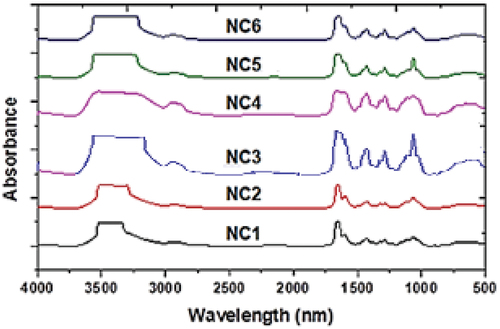
Figure 6. UV/Vis absorption spectra and Tauc Plot of CMC/PVP blend (NC1) and CMC/PVP/CuO NPs nanocomposites (NC2-NC6).
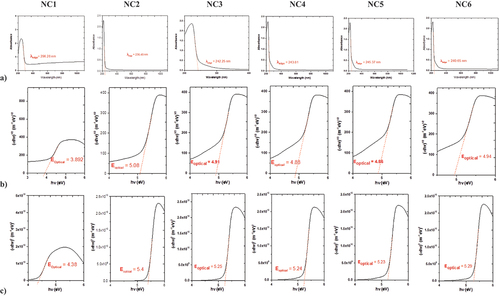
Table 5. The Wavelength (λedge) and indirect optical energy gap (Eopt1/2) and direct optical energy gap (Eopt2) for CMC/PVP blend and CMC/PVP/CuO NPs nanocomposites.
Figure 7. HUMO-LUMO calculations of the optimized 2D and 3D structural units in NC1 after H-bonding.
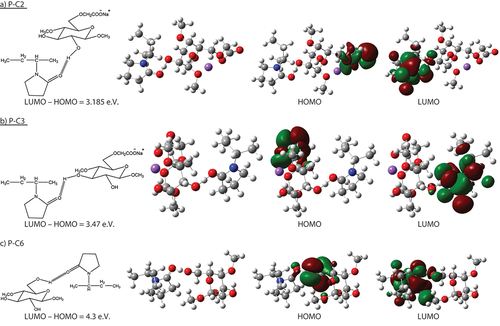
Table 6. Inhibition zone diameter of the investigated nanocomposites against E. Coli and S. aureus.