Figures & data
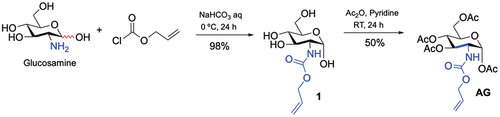
Scheme 1. Synthesis of N-alloc glycosamine monomer (N-alloc glucosamine, AG) from glucosamine.
Scheme 2. Synthesis of new sugar-based copolymers from the AG monomer with methyl methacrylate (MMA), acetonitrile (AN) and 2-hydroxyethyl methacrylate (HEMA).
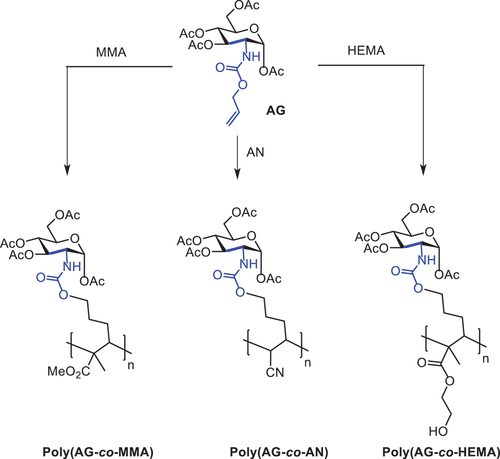
Table 1. Copolymerisation of allyl glucosamine (AG) monomer with methyl methacrylate (MMA), acrylonitrile (AN) and 2-hydroxyethyl methacrylate (HEMA) in dimethyl formamide (DMF) under a nitrogen atmosphere.
Figure 1. TIR spectra of allyl glucosamine (AG) monomer and glycopolymers (poly(ag-co-MMA), poly(ag-co-AN) and poly(ag-co-HEMA)).
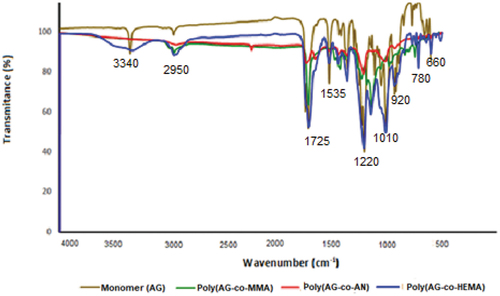
Figure 2. The 1H NMR spectrum of the allyl glucosamine monomer (AG).
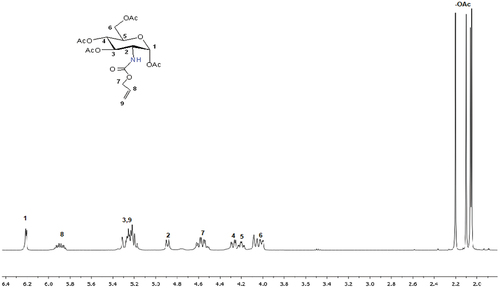
Figure 3. The 1H NMR spectrum of the copolymer (Poly(ag-co-MMA)).
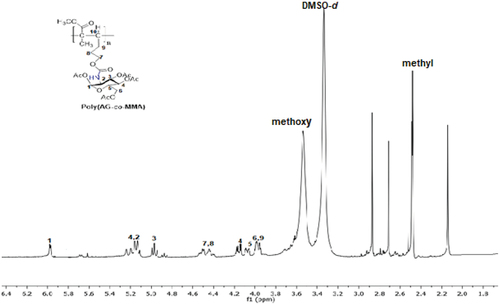
Figure 4. The 1H NMR spectrum of the copolymer (Poly(ag-co-AN)).
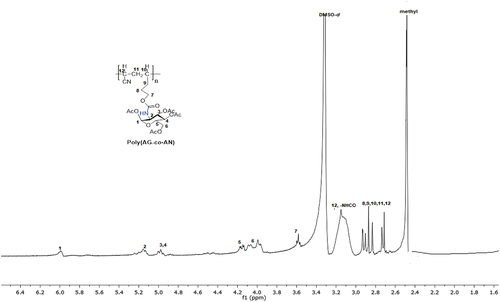
Figure 5. The 1H NMR spectrum of the copolymer (Poly(ag-co-HEMA)).
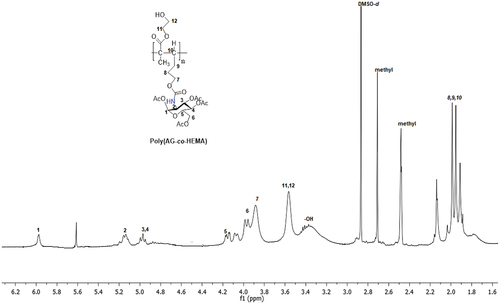
Figure 6. The 13C NMR spectrum of the allyl glucosamine monomer (AG).
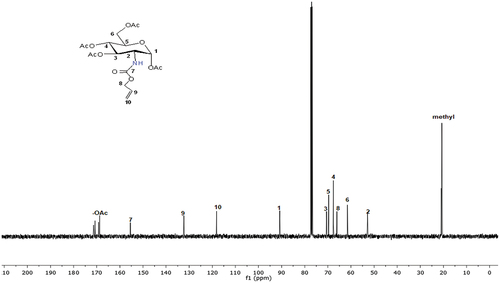
Figure 7. The 13C NMR spectrum of the copolymers (Poly(ag-co-MMA)).
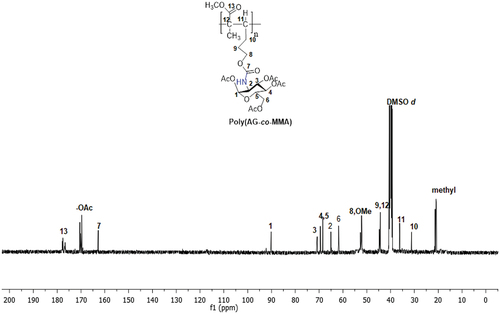
Figure 8. The 13C NMR spectrum of the copolymers (Poly(ag-co-AN)).
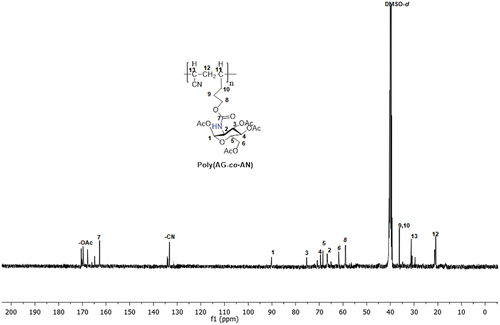
Figure 9. The 13C NMR spectrum of the copolymers (Poly(ag-co-HEMA)).
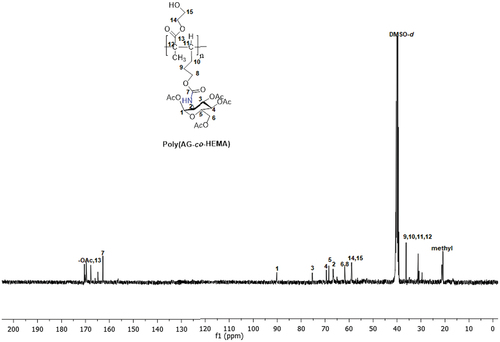
Figure 10. The TG and DTG thermograms of a) Poly(AG-co-MMA) b) Poly(AG-co-HEMA) c) Poly(AG-co-AN).
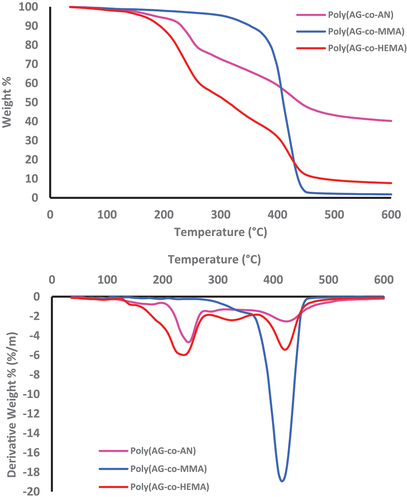
Figure 11. TG curves of a) Poly(AG-co-MMA) b) Poly(AG-co-HEMA) c) Poly(AG-co-AN) at heating rates of 5, 10, 15, and 20 °C/min.; in nitrogen atmosphere.
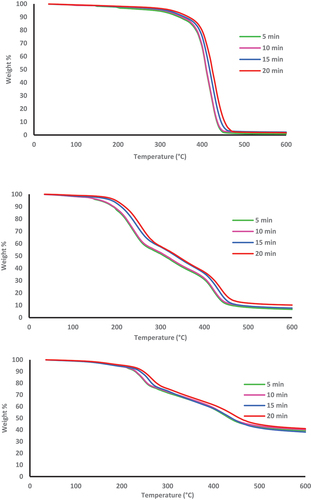
Table 2. Activation energies (Ea, kJ/mol) of poly(ag-co-MMA) obtained using the Flynn–Wall–Ozawa (FWO) and Kissinger methods.
Table 3. Activation energies (Ea, kJ/mol) of poly(ag-co-AN) obtained using the FWO and Kissinger methods.
Table 4. Activation energies (Ea, kJ/mol) of poly(ag-co-HEMA) obtained using the FWO and Kissinger methods.
Table 5. Number-average molecular weight (Mn), mass-average molecular weights (Mw) and polydispersity index (PDI) of synthesised glycopolymers determined using GPC.
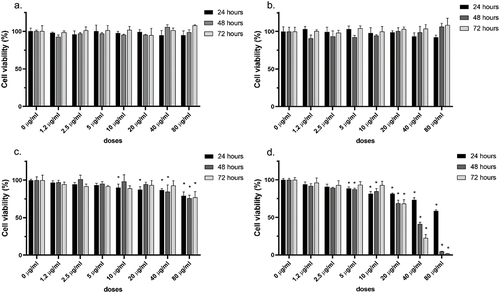
Figure 12. Effect of allylglucosamine monopolymer on cell viability in MCF-7 cell lines. Cell viability was determined by MTT analysis. Biopolymers were treated to MCF-7 cell lines at a dose of 0–80 μg/ml until 72 h. a). poly(ag-co-MMA), b). poly(ag-co-AN), c). poly(ag-co-AN) and d). monomer (AG). The results represent the average of three independent tests.Data are expressed as mean±standard deviation. (*p<0.05).