
Figures & data
Scheme 1. Overall reaction scheme showing the partial hydrolysis of poly(2-oxazoline)s followed by the subsequent aza-Michael addition.
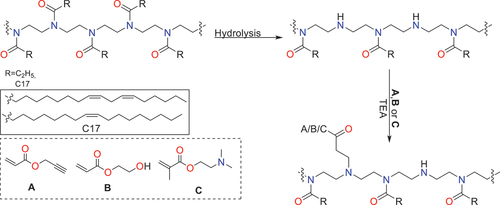
Table 1. Summary table for the conditions studied for the aza-Michael additions carried out for PEtOx (PE1-PE7) and PFAOx (PF1-PF4.).
Figure 1. a) hydrolysis kinetics showing PFAOx hydrolysed in 8:2 THF/HClaq (black), PEtOx hydrolysed in 8:2 THF/HClaq (red), PEtOx hydrolysed in 6.3:1.3:2.4 1,4-butanediol/water/HClaq (blue), PEtOx hydrolysed in 8:2 THF/HClaq at 100 °C (green) and PEtOx hydrolysed in 8:2 water/HClaq (purple). b) corresponding first-order kinetic plot. All reactions were carried out with 35–37% HClaq such that [H+]=2.4 M and [A]=0.48 M. PFAOx hydrolysis was calculated according to EquationEquation 1(1)
(1) and all PEtOx hydrolysis rates were calculated according to Equation 12.
![Figure 1. a) hydrolysis kinetics showing PFAOx hydrolysed in 8:2 THF/HClaq (black), PEtOx hydrolysed in 8:2 THF/HClaq (red), PEtOx hydrolysed in 6.3:1.3:2.4 1,4-butanediol/water/HClaq (blue), PEtOx hydrolysed in 8:2 THF/HClaq at 100 °C (green) and PEtOx hydrolysed in 8:2 water/HClaq (purple). b) corresponding first-order kinetic plot. All reactions were carried out with 35–37% HClaq such that [H+]=2.4 M and [A]=0.48 M. PFAOx hydrolysis was calculated according to EquationEquation 1(1) DegreeofHydrolysis%=100IH,tf−IH,t0IP(1) and all PEtOx hydrolysis rates were calculated according to Equation 12.](/cms/asset/7e3ed19b-299b-47c4-a8e6-2a970c688186/tdmp_a_2267232_f0001_oc.jpg)
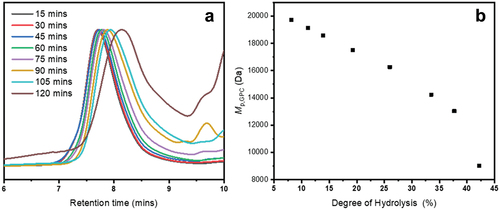
Figure 2. a) GPC chromatograms for the hydrolysis of PFAOx, showing the shift to lower molecular weight and the increase in tailing at higher degrees of hydrolysis. b) plot of Mp,GPC with degree of hydrolysis.
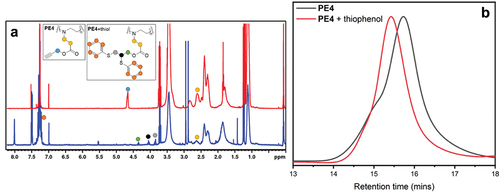
Scheme 2. Partial reaction scheme for the thiol-yne click reaction of PE4.
Figure 3. 1H NMR spectrum of PE4 before and after thiol-yne click reaction (a), and the GPC traces (RI detector) of PE4 before and after reaction with thiophenol (b).
Supplemental Material
Download MS Word (301.9 KB)Data availability statement
FURTHER DATA WILL BE AVAILABLE UPON REQUEST.