
Figures & data
Figure 1. Chemical structure of the polymer electrolytes examined in this study (m = 0: linear homopolymers; m > 0: polymer networks).
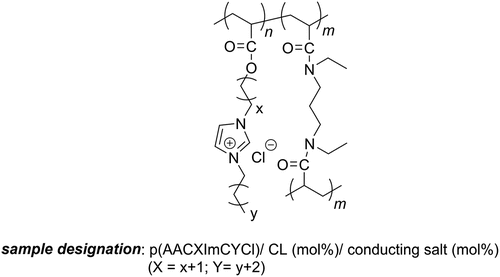
Figure 2. Glass transition temperatures of all investigated PIL networks with varied alkyl spacer X and imidazolium substituent lengths Y as well as crosslinker and conducting salt content (p(AACXImCYCl)/CL (mol%)/conducting salt (mol%)).
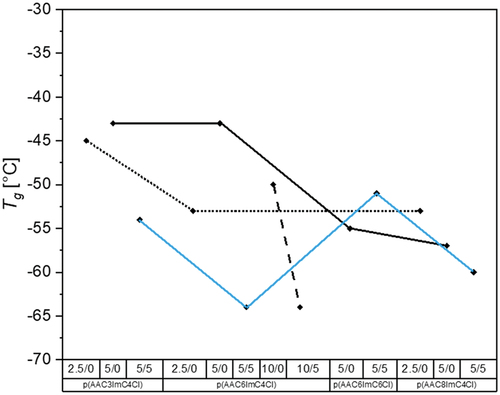
Table 1. Glass transition temperatures of the investigated polymer network samples p(AACXImCYCl)/CL (mol%)/conducting salt (mol%).
Figure 3. Complex viscosity of the p(AAC6ImC4Cl)/CL (mol%)/conducting salt (mol%) IL networks.
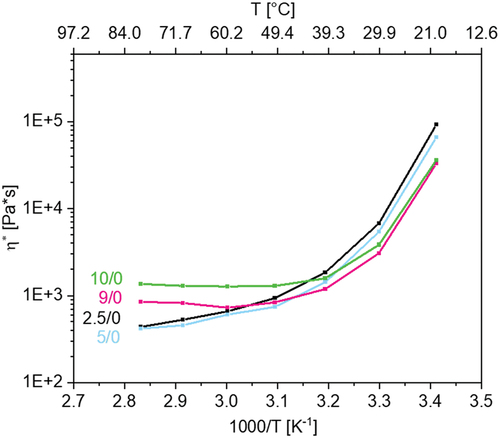
Figure 4. (a) influence of alkyl number N (total number of C atoms) with 2.5 mol% crosslinker and without conducting salt, and (b) influence of conducting salt and crosslinker on the viscosity in dependence of temperature of p(AAC6ImC6Cl)/CL (mol%)/conducting salt (mol%) network samples.
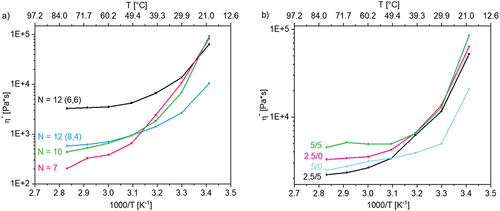
Table 2. Fitting parameters η0, B, T0, and the correlation coefficient R2 obtained by the VFT Equationequation (1)(1)
(1) for the p(AACXImCYCl)/CL (mol%)/conducting salt (mol%) network samples.
Figure 5. Ionic conductivites of p(AACXImCYCl)/CL (mol%)/conducting salt (mol%) IL networks with different crosslinker content and without conducting salt as a function of temperature.
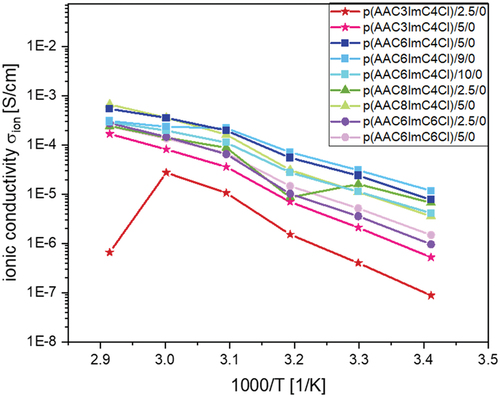
Figure 6. Ionic conductivites of p(AACXImCYCl)/CL (mol%)/conducting salt (mol%) IL networks with 5 mol% conducting salt TBACl as a function of temperature.
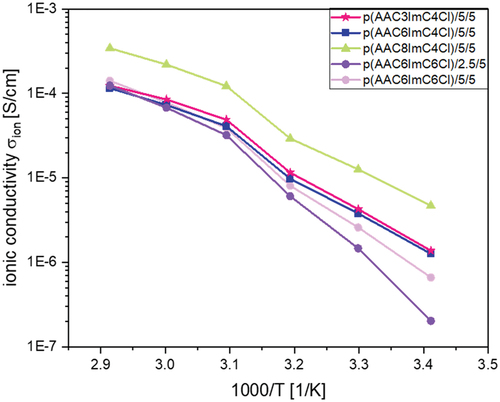
Table 3. Fitting parameters σ∞, EA, and the correlation coefficient R2 obtained using the Arrhenius Equationequation (8)(8)
(8) for the p(AACXImCYCl)/CL (mol%)/conducting salt (mol%) network samples (samples written in italic: one data point was masked for better R2 value).
Figure 7. Swelling behavior of p(AAC6ImC6Cl)/CL (mol%)/conducting salt (mol%) IL networks in water (analyzed after one week of swelling).
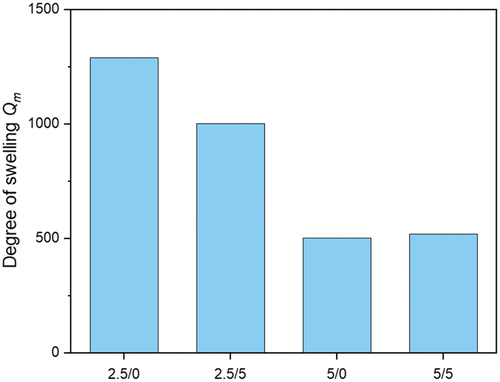
Table 4. Ionic conductivities (at 20°C) of p(AAC6ImC6Cl)/CL (mol%)/conducting salt (mol%) IL network samples before and after swelling.
Figure 8. Redox reactions of p(TEMPO-MA)+/p(TEMPO-MA) and Zn2+/Zn0 redox couple.
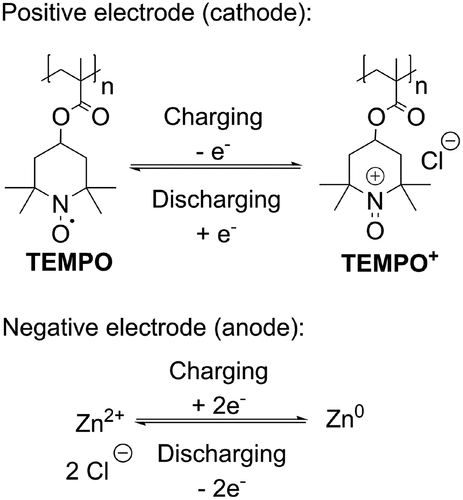
Figure 9. Nyquist plot of the PEL with crosslinker, conducting salt and ionic liquid.
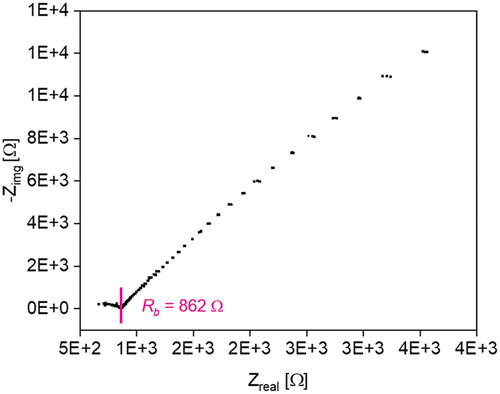
Figure 10. SEM images taken at a) the cross-section of the cathode p(TEMPO-MA) penetrated with PEL, b) zoom-in.
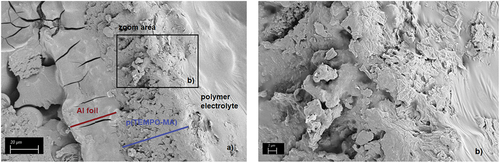
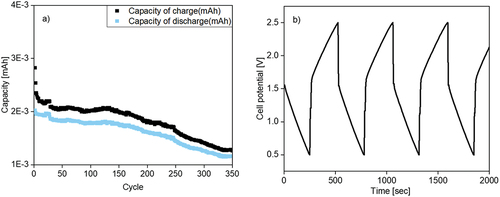
Figure 11. p(TEMPO-MA)/zinc battery with polymer electrolyte, a) charge/discharge capacities during cycling, b) selected charge/discharge curves.
Supplemental Material
Download MS Word (2 MB)Data availability statement
The data that support the findings of this study are available in the supplementary material of this article (Supporting Information).