
Figures & data
Figure 1. Flow chart of GO-SiO2 hybrid preparation.
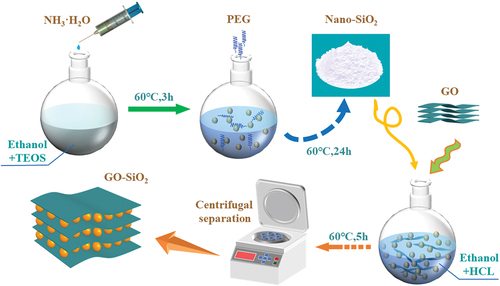
Figure 2. FT-IR spectra of GO, nano-SiO2, and the GO-SiO2 hybrid.
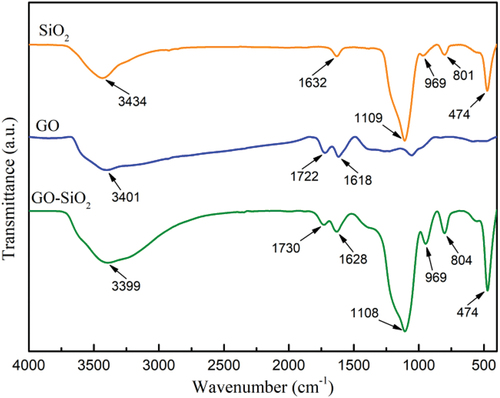
Figure 3. XRD patterns of pure GO, nano-SiO2 and GO-SiO2 hybrid.
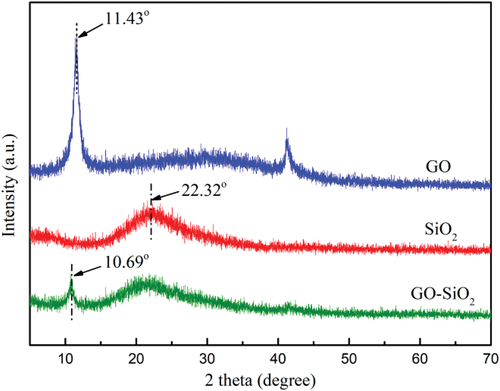
Figure 4. SEM micrographs of (a) nano-SiO2, (b) GO-SiO2 hybrid, and (c) local of GO-SiO2.
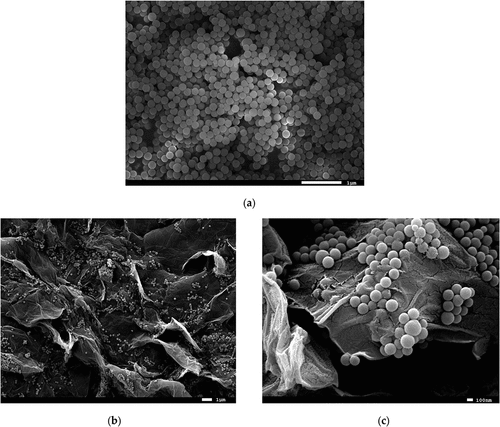
Figure 5. Force-displacement curves (a),apparent density (b) for RPUF with different contents of GO-SiO2 hybrid.
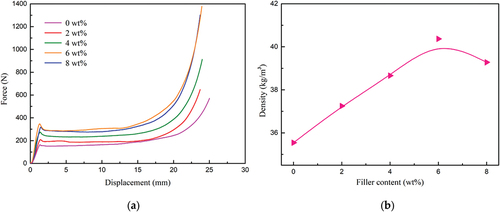
Figure 6. Compressive strength and modulus (a), energy absorption (b) for RPUF with different contents of the GO-SiO2 hybrid.
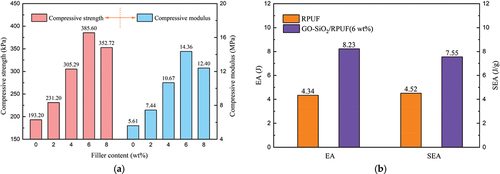
Figure 7. Progressive lateral compression deformation mode of ET and FFT.
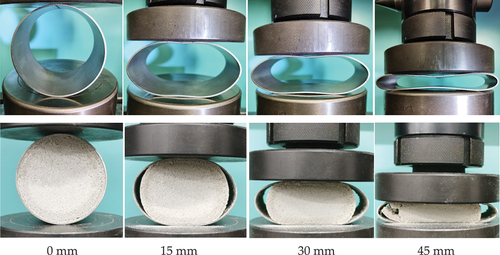
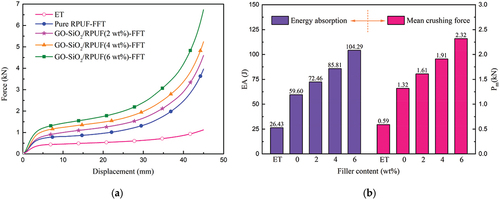
Figure 8. Comparison of force–displacement curves (a) and energy absorption (b) diagrams for FFT with different filler contents.
Data availability statement
The data used to support the findings of this study are included in the article.