
Figures & data
Figure 1. Synthetic route of tetra-branch poly propylene oxide-block-polyethylene oxide.
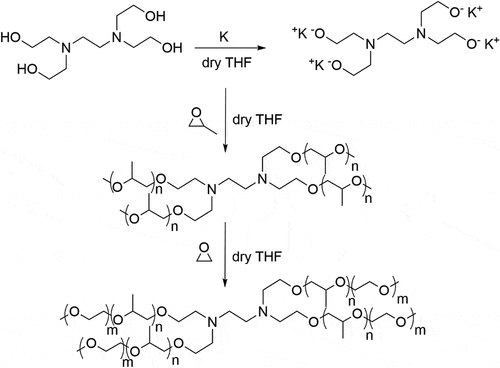
Table 1. Target structural parameters of the synthesis of tetra-branch poloxamines.
Figure 2. Representative DSC results of sample 5 at varying concentrations (Mw = 1.5 k, EO: PO = 3:2).
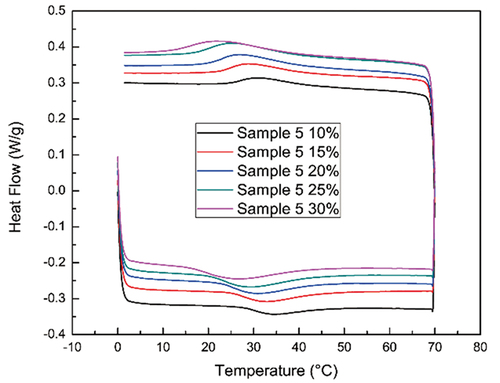
Figure 3. The estimated intercepts and slopes obtained from fitting the model Equationequation (1)(1)
(1) to the experimental data (left) along with an estimated regression line, also called an estimated regression surface, for describing the relationship between the intercepts, or slopes, and sample properties (right).
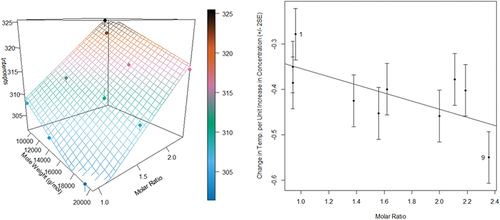
Figure 4. Fitted regression lines relating average peak temperature to concentration percentage for each experimental sample.
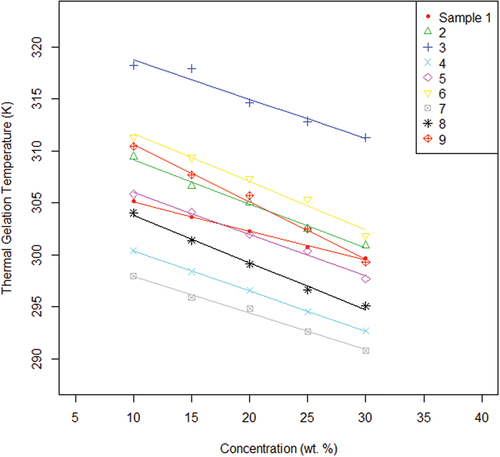
Figure 5. Representative GPC chromatogram of sample TS-3.
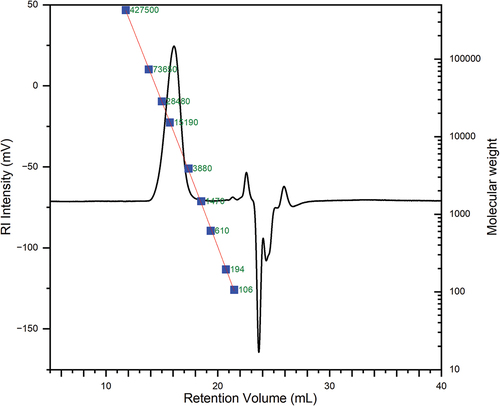
Figure 6. Representative rheology measurement result of 30% sample TS-3 in DI water.
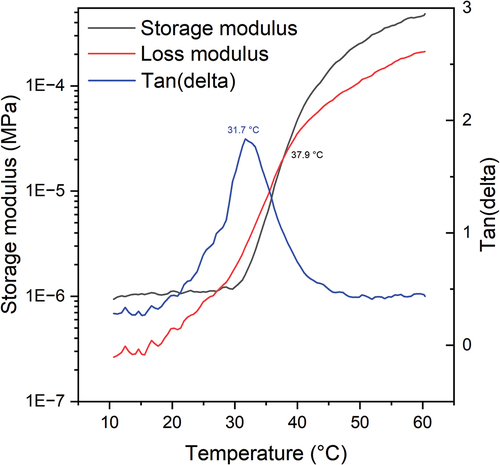
Table 2. Structure parameters of test samples for model validation and the comparison between experimentally measured transition temperatures and model estimated transition temperatures.