
Figures & data
Scheme 1. Systematic illustration to synthesize monomers BPy and polymer PPyTri.
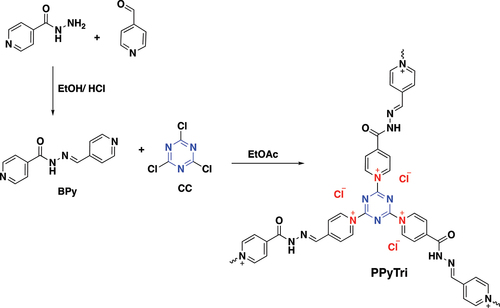
Figure 1. FT-IR spectra for monomers BPy and CC, and the polymer PPyTri.
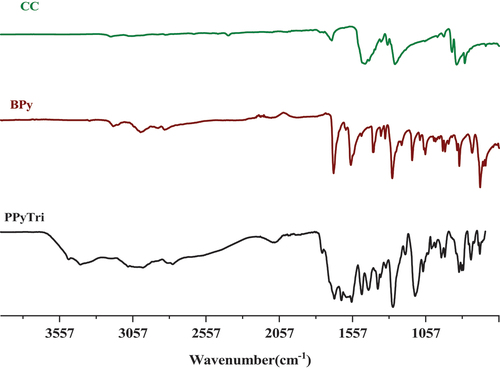
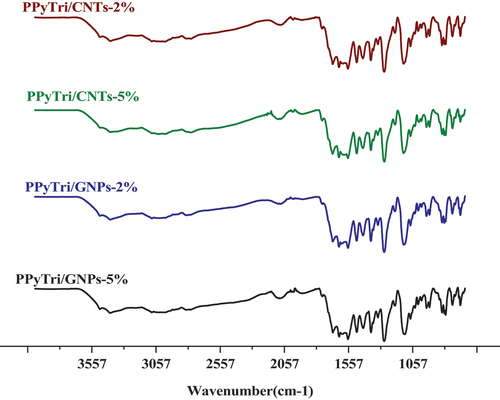
Figure 2. FT-IR spectra for nanocomposites.
Scheme 2. Systematic illustration of nanocomposite fabrication for PPyTri/CNTs-5%, PPyTri/CNTs-2%, PPyTri/gnps-5%, and PPyTri/gnps-2%.
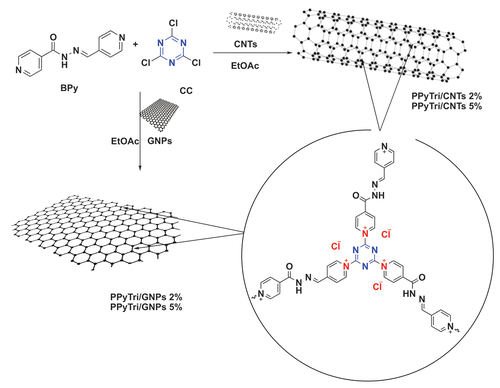
Figure 3. [Citation1]H NMR spectra for the monomer BPy and polymer PPyTri.
![Figure 3. [Citation1]H NMR spectra for the monomer BPy and polymer PPyTri.](/cms/asset/342e4350-d8cd-4287-acfa-c9a1123ba0cf/tdmp_a_2360746_f0003_oc.jpg)
Figure 4. [Citation13]C NMR1H NMR spectra for the monomer BPy and polymer PPyTri.
![Figure 4. [Citation13]C NMR1H NMR spectra for the monomer BPy and polymer PPyTri.](/cms/asset/be4d6a83-0d54-46c0-a019-931e66cb9aa5/tdmp_a_2360746_f0004_oc.jpg)
Figure 5. PXRD diffraction patterns for the pure copolymer PPyTri and its nanocomposites.
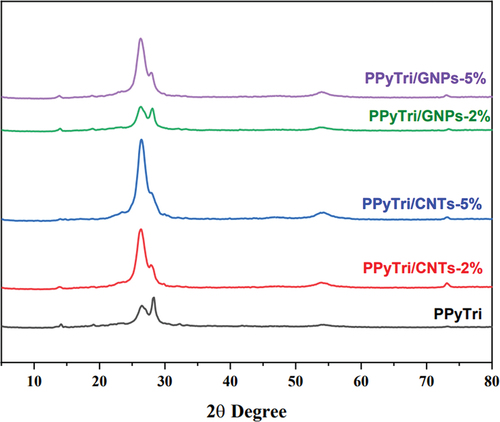
Figure 6. SEM images of the pure copolymer and its nanocomposites PPyTri, PPyTri/CNTs-2%, and PPyTri/gnps-2%.
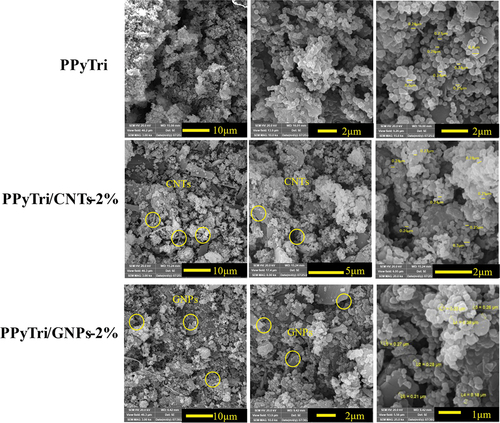
Figure 7. EDX elemental maps of the pure copolymer and its nanocomposites PPyTri, PPyTri/CNTs-2%, and PPyTri/GNPs-2%.
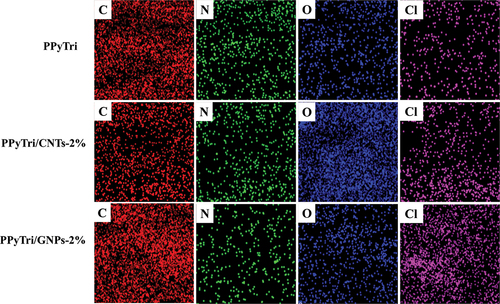
Figure 8. TEM images of the nanocomposites PPyTri/CNTs-2% and PPyTri/GNPs-2%.
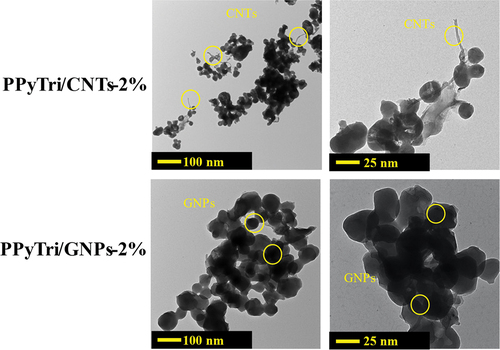
Figure 9. TGA for the pure copolymer PPyTri and its nanocomposites.
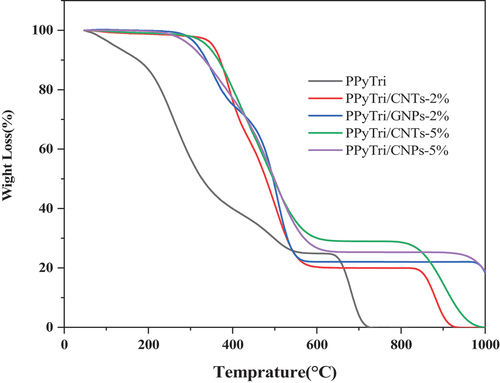
Table 1. Thermal behaviors of the polymer PPyTri and its nanocomposites.
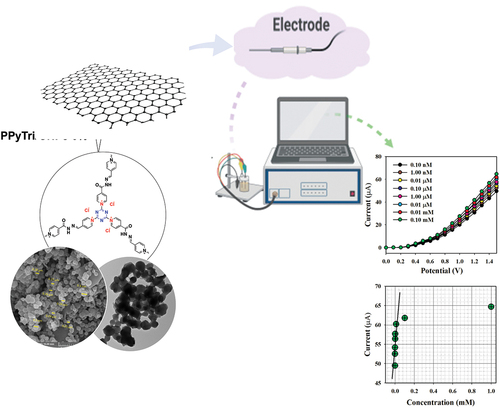
Figure 10. Classification of the sensor behaviors using the electrochemical (I-V) approach. (a) Selectivity estimation, (b) I-V responses based on variations in the Hg+2 ion concentration from low to high, and (c) calibration curve.
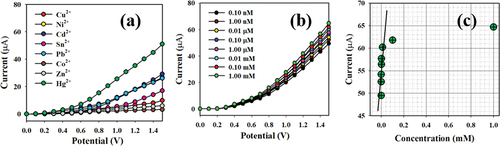
Figure 11. Control study executed at 0.1 µM Hg+2 solutions in a buffer medium with modified GCE containing PPyTri/GNPs or PPyTri/CNTs (2, 5%) nanostructure compositions.
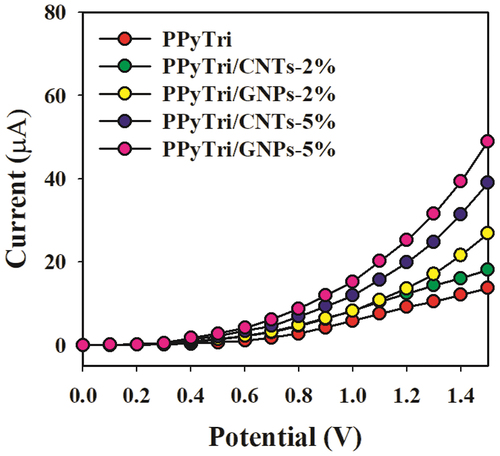
Table 2. Performance comparison of different electrochemical sensors for Hg+2 ion detection.
Figure 12. (a) Reproducibility test results and (b) response time.
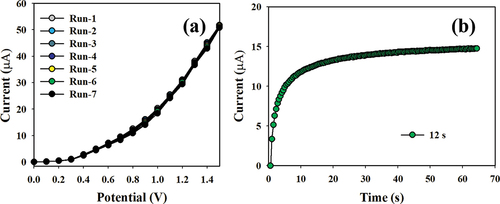
Table 3. Validation of PPyTri/GNPs-5% NCs fabricated sensor probe using real samples by recovery method.
Data availability statement
All the data has been illustrated in the manuscript text.