
Figures & data
Table 1. Chemical composition of clinker and slag.
Table 2. Mix ratio of building materials for alkali slag mine.
Figure 1. Theoretical model of the reaction mechanism of alkali activated slag cement.
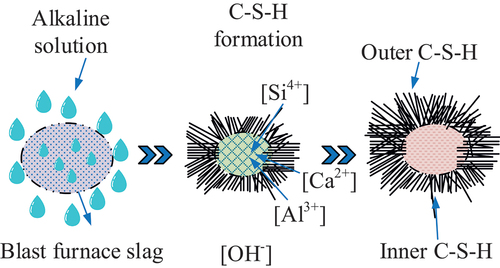
Figure 2. SEM images of ordinary slag and alkali slag cross-sections (a, b, c show the SEM images of slag at 5 μm scale; d show the SEM image of alkali slag cross-section at 10 μm scale).
Table 3. Proportioning of five CL-PCE samples.
Figure 3. Structure and molecular formula of CL-PCE (a, b, c, and d denote the structural formulas of traditional comb shaped PCE structure, low crosslinked multi arm PCE structure, high crosslinked body shaped PCE structure, and crosslinked PCE, respectively).
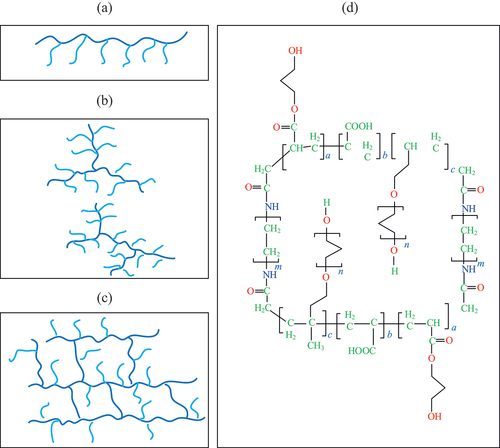
Figure 4. Changes in net slurry flowability of ASBM.
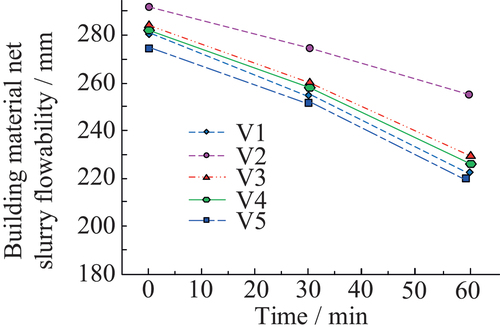
Figure 5. Setting time and time loss of CL-PCE on ASBM (a and b represent the setting time of CL-PCE for ASBM and time loss, respectively).
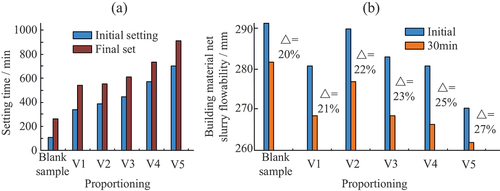
Table 4. Conductivity of building material slurry with different dosages of water-reducing agents.
Figure 6. The impact of CL-PCE on the water reduction rate and adsorption properties of ASBM mortar (a and b represent the water reduction rate of ASBM mortar and changes in adsorption capacity of CL-PCE).
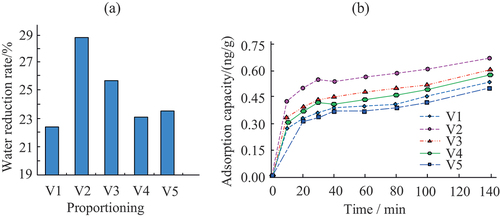
Figure 7. Changes in flexural and compressive strength of ASBM (a and b represent the flexural strength and compressive strength of ASBM, respectively).
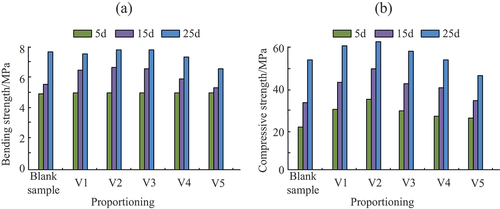
Figure 8. Microscopic view of hydration products of ASBM (a, b, c, and d show Scanning SEM images of blank samples for 5 days, V2 water reducer for 5d, blank sample 25d, V2 water reducer for 25 days, respectively).
Figure 9. Scanning electron microscopy images of ASBM with CL-PCE added at 25 days (a, b and c show the Scanning SEM images of CL-PCE with dosages of 0.0%, 0.03%, and 0.05%, respectively).
Data availability statement
The authors confirm that the data supporting the findings of this study are available within the article.