Figures & data
Figure 1. World CO2 emissions (million tons of C) and world GDP level (million constant 1990 international Geary-Khamis dollars).
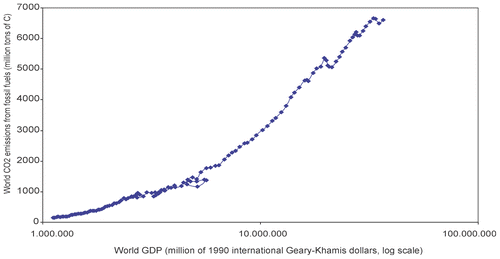
Figure 2. CO2 emission intensity (fossil fuels) of world GDP and world GDP level (million tons of C per million international constant 1990 Geary-Khamis dollars, select years indicated). Sources: CO2 emissions from fossil fuels from CDIAC, www.cdiac.org; data on GDP from www.theworldeconomy.org. Available data on total world real GDP are Angus Maddison's point estimates for 1870, 1900, 1913, and time series for 1950 – 2000. Data in the intervals 1871 – 1899 and 1901 – 1912 are our extrapolations assuming a constant average growth rate between the two available years. Data for world GDP in 1914 – 1949 are our estimates. We assumed the world GDP to be proportional, in each year of the interval, to the total GDP of a set of 44 countries in the Maddison's dataset representing 68% of world GDP in 1913 and 71% in 1950 (the same countries represent between 68 – 71% of world GDP also during the whole 1950 – 2000 period).
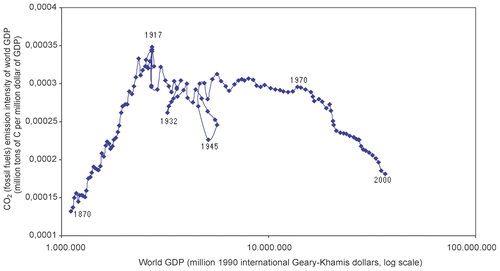
Figure 3. Packaging waste generation per capita (EU15).
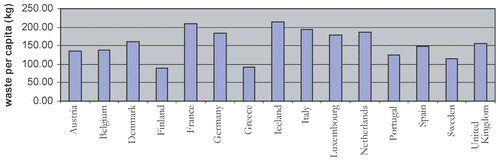
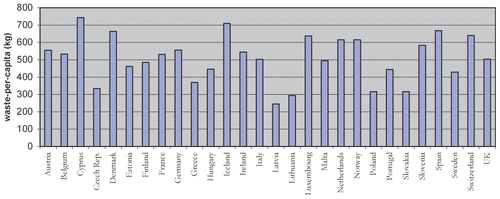
Figure 4. Municipal waste generation per capita (EU28).