Figures & data
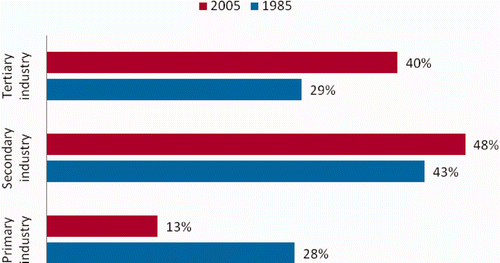
Figure 1. China economic structure comparison (1985 and 2005). Data source: http://www.stats.gov.cn/.

Register now or learn more
Free access
Figure 1. China economic structure comparison (1985 and 2005). Data source: http://www.stats.gov.cn/.

Please note: Selecting permissions does not provide access to the full text of the article, please see our help page How do I view content?
To request a reprint or corporate permissions for this article, please click on the relevant link below:
Please note: Selecting permissions does not provide access to the full text of the article, please see our help page How do I view content?
Obtain permissions instantly via Rightslink by clicking on the button below:
If you are unable to obtain permissions via Rightslink, please complete and submit this Permissions form. For more information, please visit our Permissions help page.
People also read lists articles that other readers of this article have read.
Recommended articles lists articles that we recommend and is powered by our AI driven recommendation engine.
Cited by lists all citing articles based on Crossref citations.
Articles with the Crossref icon will open in a new tab.