Figures & data
Figure 1. Schematic overview of DBDM.
Figure 2. Overview of first intervention year.
Figure 3. Proposed multi-state model for latent classes.
Table 1. Sample Characteristics of School Leaders and Schools.
Table 2. Sample Characteristics of Respondents per Measurement Occasion.
Table 3. BIC(K) for Each Combination of Latent Classes at School and Individual Level.
Figure 4. Average respondent item scores for assigned class at the individual level.
Table 4. Proportion of Individuals Assigned to Individual Class, per School Class.
Table 5. Number of Schools Assigned to Each Latent Class, per Moment.
Table 6. Probability of Being Assigned to a Latent Class at the End of the Intervention, Given the Initial Assigned Class.
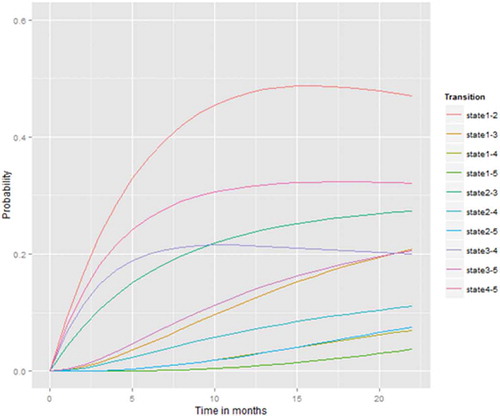
Figure 5. Transition probabilities over time, based on initial state.