
Figures & data
Figure 1. Cross-pollination materials
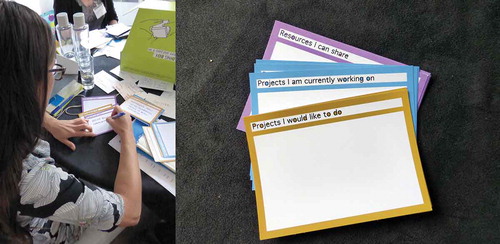
Figure 2. Different art installations representing communities that have great health
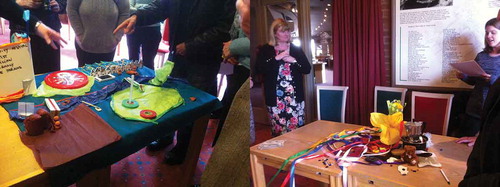
Figure 3. Left: The Scaling up network after the first cross-pollination workshop. Right: The network 12 months after the first cross-pollination workshop. Blue nodes are CSOs connected to the original project, red are universities, pink are communities, green are community projects, and grey are organisations, companies or communities that had no connection with the research project but contributed to the emerging community projects
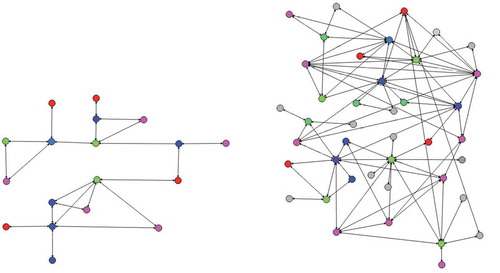
Figure 4. Asset mapping exercise
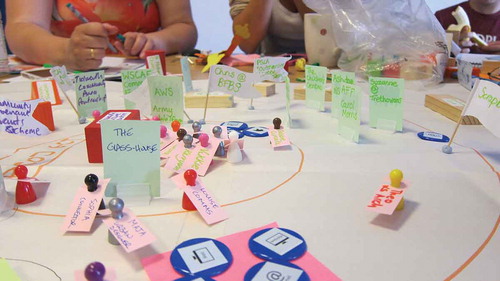
Table 1. Summary of different manifestations (types) of empowerment together with observed obstacles and associated sources of empowerment