Figures & data
Figure 1 Map showing the location of the Hartsville Coulee watershed and the river reaches modelled in this study
Figure 2 The dimensions of Thompson Bridge
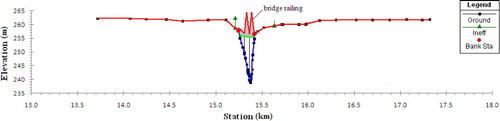
Figure 3 The overtopped RRN right bank section downstream of Thompson Bridge, superimposed by the predicted highest water surface occurred in 1997
Figure 4 The cross-sections at the US Geological Survey (USGS) flow gauging stations at (a) Halstad (USGS 05064500) and (b) Grand Forks (USGS 05082500). The labelled numbers are the calibrated Manning's n values
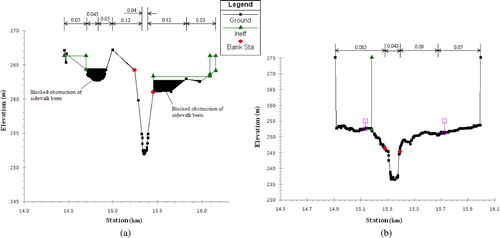
Figure 5 The cross-sections at the USGS flow gauging stations at (a) Drayton (USGS 05092000) and (b) Emerson (USGS 05102500). The labelled numbers are the calibrated Manning's n values
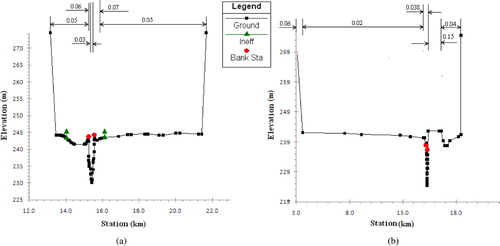
Figure 6 Schematic of the HEC-RAS model
Table 1 The tributary reaches modelled as branch in this study
Figure 7 The predicted and observed daily streamflows and stages at Halstad
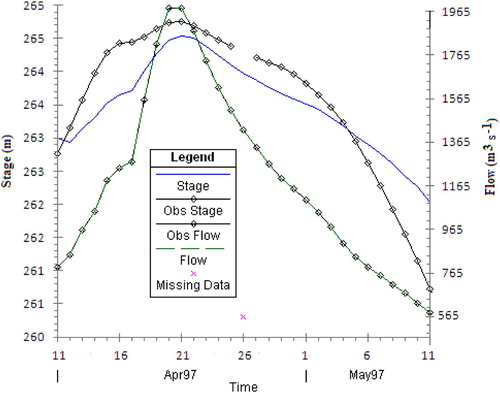
Figure 8 The predicted and observed daily streamflows and stages at Grand Forks
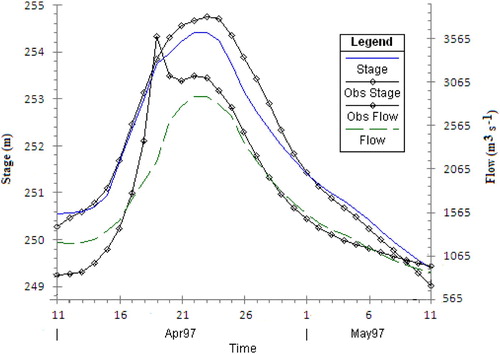
Figure 9 The predicted and observed daily streamflows and stages at Drayton
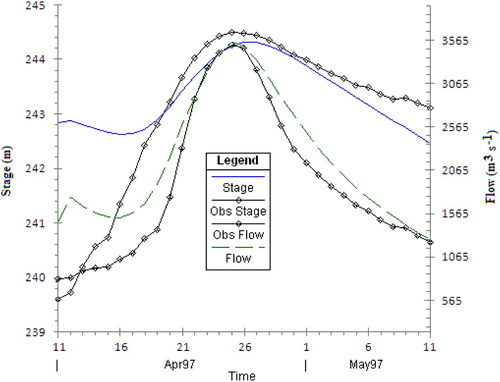
Figure 10 The predicted and observed daily streamflows and stages at Emerson
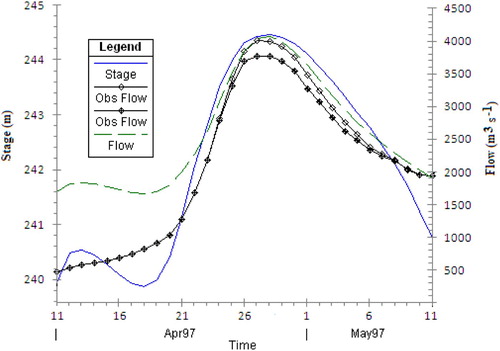
Table 2 Summary of the calibrated Manning's n values
Table 3 The model performance in predicting peaks and volumes
Figure 11 The predicted daily overflow hydrograph from the RRN into the Hartsville Coulee
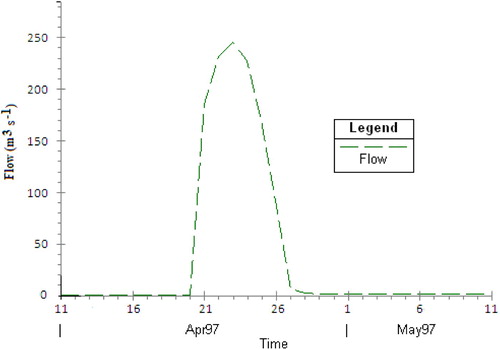
Figure 12 The predicted maximum instantaneous flow profile along the Hartsville Coulee. The zero location is the mouth of the coulee