Figures & data
Figure 1 Box plots of American River fall-run Chinook salmon spawning CSI for occupied locations calculated from measured depths, velocities, and substrates, and for occupied and unoccupied locations simulated by River2D (2D) and PHABSIM. Depths, velocities, and substrate sizes were not measured at unoccupied locations
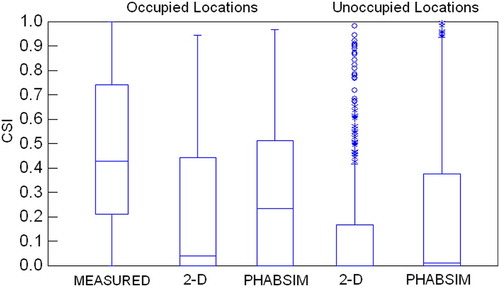
Figure 2 Frequency distributions of American River fall-run Chinook salmon spawning CSI for occupied locations calculated from measured depths, velocities, and substrates, and for occupied and unoccupied locations simulated by River2D (2D) and PHABSIM
Figure 3 Scatterplots of American River fall-run Chinook salmon redd depths simulated by River2D and PHABSIM versus measured redd depths
Figure 4 Scatterplots of American River fall-run Chinook salmon redd velocities simulated by River2D and PHABSIM versus measured redd velocities
Figure 5 Frequency distribution of American River fall-run Chinook salmon redd substrate sizes simulated by River2D and PHABSIM versus measured redd substrate sizes
Figure 6 Relations between relative availability and use and depth for the American River. Points are relative use, relative availability, or the ratio of the linearized use to linearized availability for the American River. Lines are the results of the linear regressions of the depth increment versus relative availability and use for the American River. Adapted from Gard Citation(1998)
Figure 7 Plots of percentage occupied locations versus CSI simulated by River2D and PHABSIM for American River fall-run Chinook salmon spawning. Plots of percentage occupied locations based on measured data cannot be prepared since measurements were not made at unoccupied locations