Figures & data
Figure 1 Topographical map of the Muda River (2006)
Figure 2 Model input hydrograph and tidal information of the Muda River (Julien et al. 2006)
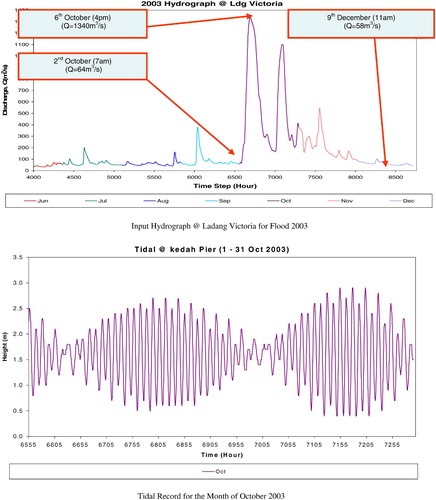
Figure 3 Distribution of roughness zone types visualized in the study area. A: wet padi; B: heavy stand of trees; and C: man-made features
Figure 4 Classification of channel types (after Rosgen Citation1994)
Figure 5 Flowchart of the methodological approach to flood modelling in the GIS environment
Figure 6 Comparisons of the present cross-section (new bridge) and the cross-section from the year 1993 (old bridge) (Julien et al. 2006)
Figure 7 Change to the longitudinal profile of the Muda River
Figure 8 Changes in the land use and land cover of the Muda area during the period 1984–2001
Figure 9 Flood peaks of the Muda River from 1960 to 2005
Figure 10 Flood frequency analyses for the Muda River at Ladang Victoria based on Gumbel Extremal Type I for discharge data of 1960–2005
Figure 11 A schematic representation of the river's cross-section against the distribution of ground roughness zones at (a) CH 39.50 and (b) CH 15.00
Figure 12 A comparison between the predicted and observed water level values at (a) CH 14.0 and (b) CH 41.2
Figure 13 Real-time geographical visualization of the 2003 flooding event as processed in InfoWorks RS (CH 28.00–CH 31.00)
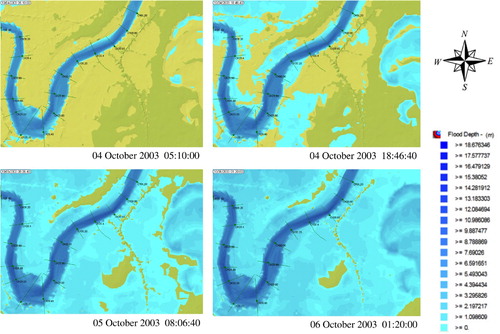
Figure 14 Hydrograph of the 1984 flood
Figure 15 Comparision between the 1984 and 2003 flood conditions
Figure 16 2005 Flood hydrograph
Figure 17 Inundated areas for 2003 and 2005 floods. (a) December 2005 peak flow flood (CH 15.00–CH 20.00) and (b) October 2003 peak flow flood (CH 15.00–CH 20.00)