Figures & data
Figure 1 Photograph of a clump of E.curvula and the definition of key parameters in this study. D c: clump diameter (m), h v: clump height (m), M: clump density (number of clumps / m2)
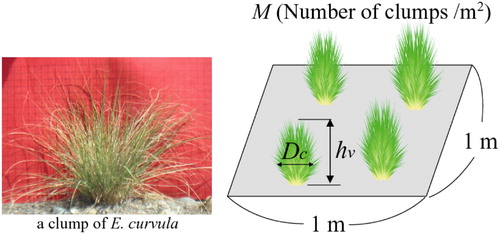
Table 1 Experimental conditions for drag force measurement on E. Curvula
Figure 2 Measurement of drag force acting on E. curvula and a clump model. (a) Wind tunnel experiment, (b) schematic of the measurement method in a river (L 1, L 2 is 65 cm, 45 cm, respectively, in this study)
Figure 3 Relationship between relative plant height to water depth and the drag coefficient C d of E. curvula. h v-def is the deflected plant height, H is the water depth
Figure 4 Field investigation site and differences in vegetation density and clump size of E. curvula. (a) Arakawa-ohashi (AR): SF is fringe region of the vegetation, SC is the centre region of the vegetation (in SF and SC region, clump size and the density is low, D c = 10–20 cm), DF is fringe region of the vegetation, DC is the centre region of the vegetation (in DF and DC region, clump size and the density is high, D c = 30–50 cm), (b) Kumagaya-ohashi, KU: clump size and the density is low, D c =10–20 cm
Figure 5 Characteristics of E. curvula, relationship between: (a) D c and shoot height (h v (m)), (b) D c and plant density (clumps/m2), and (c) D c and bending stiffness EI M (E: Young's modulus (N/m2), I M: second moment of area (m4))
Table 2 Conditions for calculating friction velocities around E. curvula
Figure 6 Local scour around E. curvula. (a) Relationship between the flood water depth (H (m)) and the local scour depth (h s (m)), and (b) photograph of the scouring situation around E. curvula after a flood. D c is the clump diameter (m), L R is the root penetrating depth (m)
Figure 7 The comparison of the duration time in which τ e exceeded τ c84 at the AR and KU. τ e: the shear stress considering the clump diameter and plant density of E. curvula, τ c84: is the critical shear stress of d 84. The site characteristics are shown in . SC, DC and SF are defined in . The blank symbols mean E. curvula did not wash out due to flood. The filled symbol mean washed out due to flood
Table 3 Field and river characteristics used in this study
Figure 8 Relationship between D c and threshold size of movement, d s-crit, as a function of the number of clumps, M (clumps/m2). The dashed line shows the mean diameter at the investigated site (H = 2 m, I = 1/400, d 50 = 1 cm)
Figure 9 Relationship between water weight on the bed (slope direction), ρgHI, and the representative parameter for growth and the drag, MD c 1.5. (a) Schematic of the relationship between (MD c 1.5)crit and (ρgHI)crit, (b) change of (ρgHI)crit,as a function of D c (I = 1/375, d 50 = 0.9 cm)
Figure 10 Validation of the wash-out condition of E. curvula. (a) Fringe region in Arakawa River, (b) centre region in Arakawa River. The site characteristics are shown in