Figures & data
Figure 1. The cycle of dike management for flood control. The model illustrates the influence of advances in science (e.g. climate change, sea level rise, subsidence, etc.), large flood disasters, and technological advances in engineering.
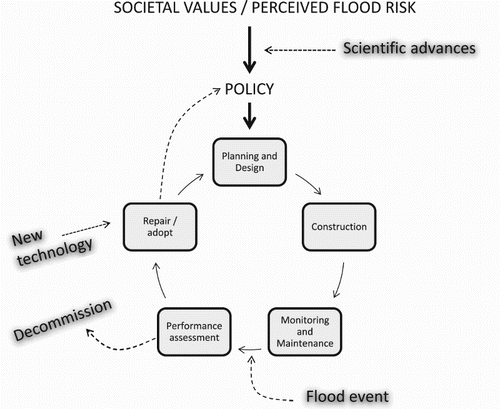
Table 1. Comparative physical and human indices of lower Mississippi and lower Rhine Rivers.
Table 2. Major elements of IFM adapted to the Rhine deltaa.
Table 3. Management structure for the Dutch Rhine.
Table 4. Management structure for the lower Mississippi.
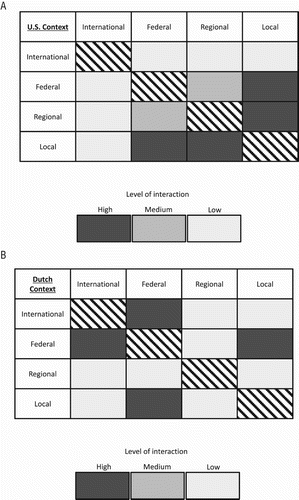
Figure 2. (A) Lower Mississippi model (U.S. context). The structure and relationship between different governmental scales for flood management along the lower Mississippi in Louisiana. (B) Lower Rhine model (Dutch context). The structure and relationship between different governmental scales for flood management in the Netherlands.