Figures & data
Table 1. Overview of environmental projects on the Litani River from 1994 to 2020 (Adapted from Shaban & Hamzé, Citation2018).
Table 2. Main targets and indicators of SDG6.
Figure 1. Location of the Lake Quaraoun and Litani basin in the map of Lebanon, East Mediterranean.
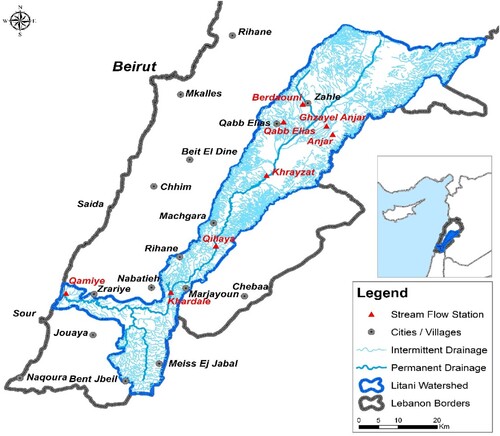
Figure 2. Water use in Lebanon between 1998 and 2017, Km3 year−1 (Source: FAO, Citation2016).
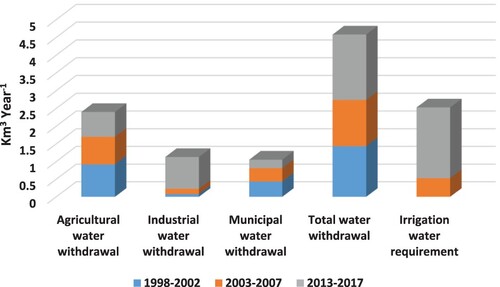
Figure 3. Disposal of solid waste near agricultural fields in Central Bekaa Plain (Photo: T. Darwish). Field inspection of nitrate content in shallow aquifers in Central Bekaa area, Spring 2002 (Source: Darwish et al., Citation2004).
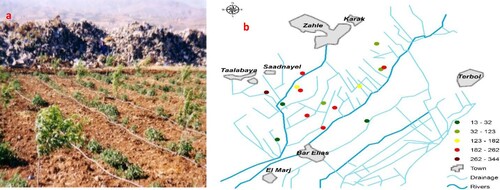
Figure 4. Shallow water table depth in the Central Bekaa Plain of Lebanon reveals high vulnerability to contamination (Source Darwish et al., Citation2004).
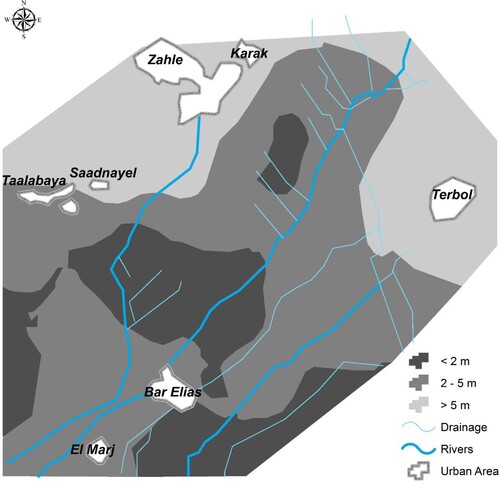
Figure 5. Irrigation of fruit trees using non treated sewage water, mixed with collected shallow water table (drainage water) in Central Bekaa (a and b). Sediments on soil surface after irrigation using non treated sewage water in Central Bekaa (c).
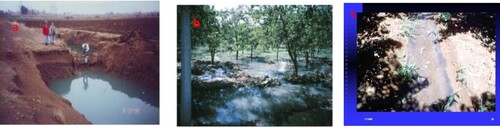
Table 3. Tolerable annual load of trace elements to agricultural soils and their limit content in sludge.
Figure 6. Green-blue water coloured by cyanobacteria pigment in the reservoir of Quaraoun, collected on February 2020 (Source: LRA, Citation2020).
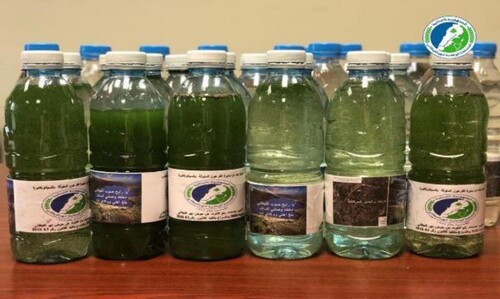
Figure 7. Driving forces of water sector regression in water supply and sanitation services defined by the questioned stakeholders of the Litani River Basin (Source: Shaban et al., Citation2018).
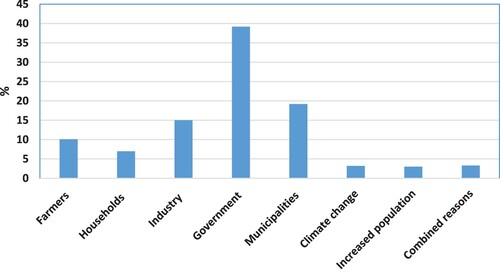
Figure 8. Amount of water leaching (mm) as a function of irrigation technique and nitrogen application (N0-Control drip no nitrogen; Ncd- Control drip nitrogen soil application; Ncs- Control macro sprinklers nitrogen soil application; N1-3- Full Fertigation with nitrogen in N2=Ncs) (Source: Darwish et al., Citation2003).
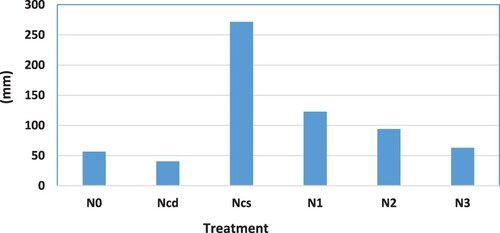
Figure 9. Outlets of non-treated sewage water (spots in red) ejected directly to the Litani River (Source Litani River Authority, 2020)
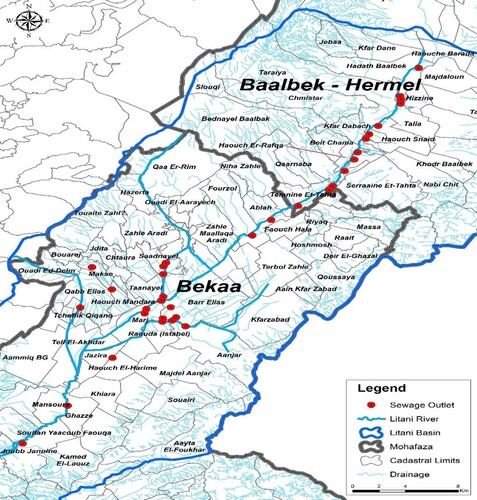
Table 4. Contextualization of SDG 6 to the Litani River Basin.
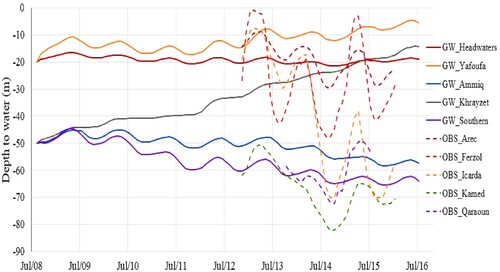
Figure 10. Depth to groundwater (m) in several groundwater nodes vs. the five monitoring wells in the Upper Litani Basin (Source: Hackett, Citation2020).