Figures & data
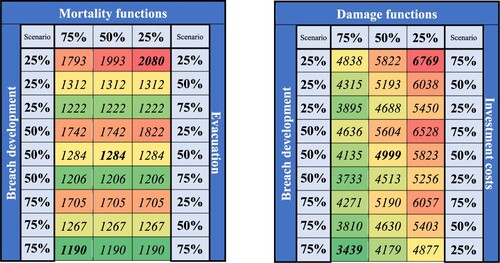
Figure 1. Land use map of the case study area, in which the 6 separate dike segments (43-1 to 43-6) are highlighted. The breach locations considered in the flood simulations are shown as stars.
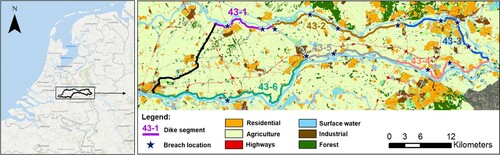
Figure 2. Schematization of the main steps in the flood safety standard derivation process, along with the involved model environments used. The uncertainty sources incorporated in the uncertainty analysis are shown with the dashed impact lines, directed towards the component in the safety standard derivation methodology which is impacted by these uncertainty sources.
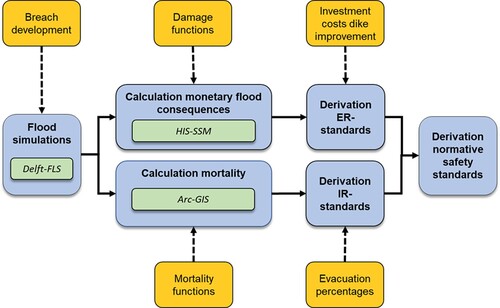
Figure 3. Schematic overview of the main research steps in this study and the sequence in which they are carried out, along with the accompanying paragraphs in which the step is further described.
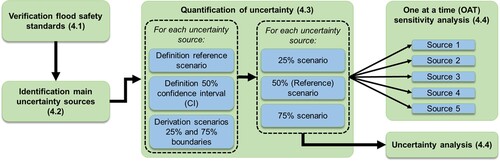
Table 1. Verification IR and ER standards found in this study compared to the legal standards defined by Slootjes and Wagenaar (Citation2016). Note that these values have not been aggregated yet into classes, hence do not correspond with the legal standards (those are the rounded values derived from the values by Slootjes and Wagenaar (Citation2016)).
Table 2. Uncertainty sources included in this study, along with an indication for which of the risk-based criteria the uncertainties are considered.
Table 3. Triangular distibution for erodibility parameter Uc based on the minimum, maximum and most commonly found sand /clay ratios for flood dike segment 43-6 according to Verheij (Citation2003).
Figure 4. Overview of all uncertainty quantification scenarios derived in this study, along with the verification scenario for each uncertainty source. (A) breach growth, (B) Evacuation, (C) Example of one of the damage functions for landuse type 'low residential buildings', (D) Investment costs for flood defence improvement, (E) Mortality functions. In case the verification scenario equals the 50% (reference) scenario, no seperate verification scenario is shown (this is the case for the damage function and investment cost).
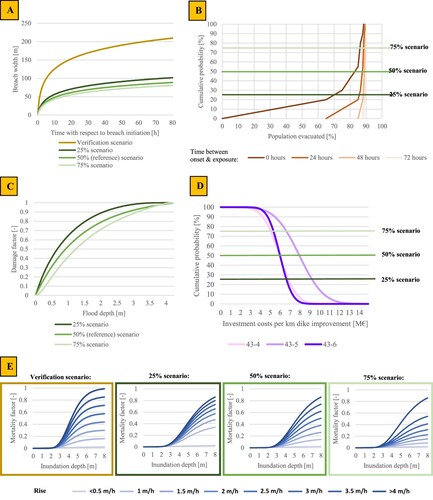
Table 4. Overview of the ranked uncertainty sources from the expert elicitation process, along with the average scores, standard deviation and number of times a score was given by the experts.
Figure 5. Influence of scenarios per uncertainty source on the flood safety standards for the individual dike segments. (A) Breach development; (B) Mortality functions; (C) Evacuation; (D) Damage functions; (E) Flood defence investment costs. Note: A shows the influence for both IR and ER standards, B and C show the influence on IR standards and D and E show the influence on ER standards.
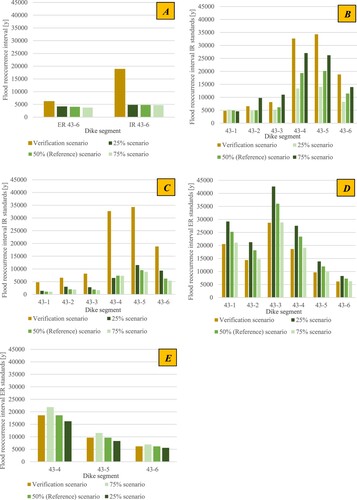
Figure 6. Flood arrival times after breach initiation, for safety standard segment 43–1 (highlighted in purple, breach locations are indicated as black stars). The neighbourhoods are shown by the light gray lines. The flood arrival times in the IR-normative neighbourhoods for the verification scenario (brown box) and the 50% confidence interval evacuation scenarios (green boxes) are shown as well. (dark green = 25% scenario, middle green = 50% scenario, light green = 75% scenario).
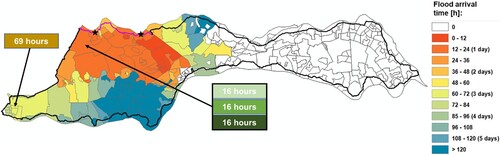
Figure 7. Uncertainty analysis results for IR standards (left) and ER standards (right) for dike segment 43-6: Each unique scenario combination is represented. Unit of the results is the annual flood probability in (y−1). The colouring eases the interpretation of the figure. The colour shifts from green to red for stricter safety standards.