Figures & data
Figure 1. Flowchart of the proposed methodology.
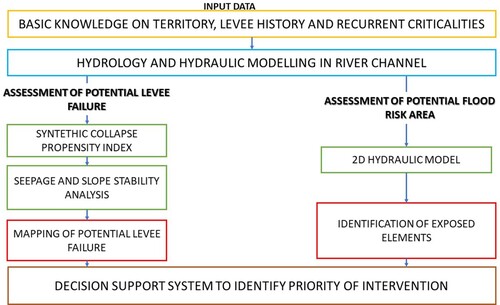
Table 1. Risk matrix, with the collapse propensity hazard classes on the rows and the exposures classes on the columns.
Figure 2. Diagram for the Marchi (Citation1957) model: river cross-section and phreatic line (adapted from in Solari et al., Citation2014).
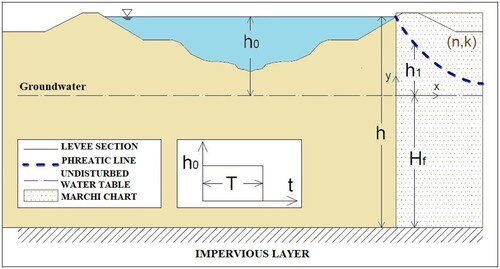
Figure 3. Schematization of the levee with the main parameters (adapted from in Solari et al. (Citation2014)).
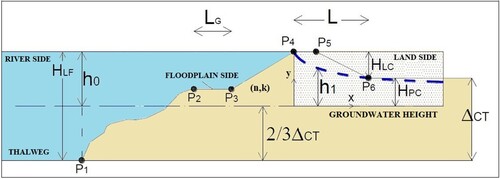
Figure 4. Definition of the persistence time TP.
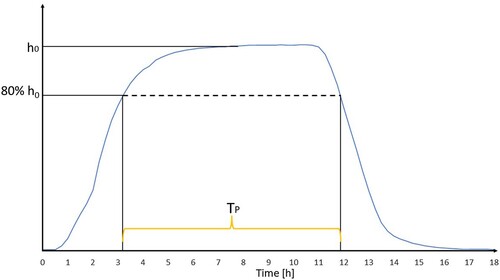
Table 2. Indexes classification.
Figure 5. From left to right: the 1992 flood, the 2009 flood, the Ombrone levee breach.
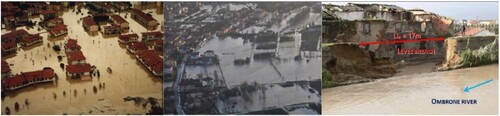
Figure 6. The study area and the location of the 17 sub-reaches.
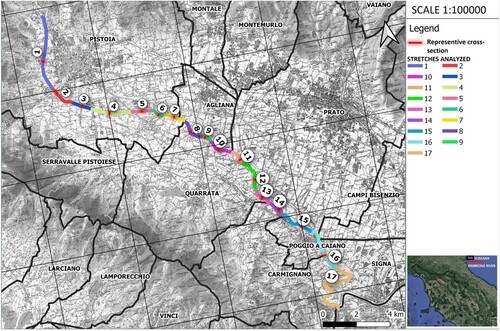
Figure 7. Seepage analysis with k = 5*10-5 m/s for 454 cross-section.
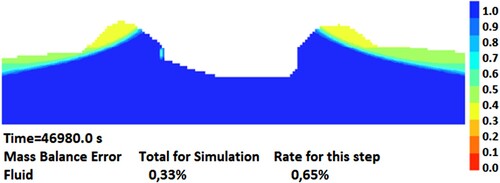
Table 3. SF of all stability tests (in bold the values that do not satisfy the limit values).
Table 4. Results of propensity index for levee collapse, for left and right bank (in bold the values of high hazard class values).
Figure 8. Example of the flooded area induced by the potential levee breach for left bank cross-section number 16.
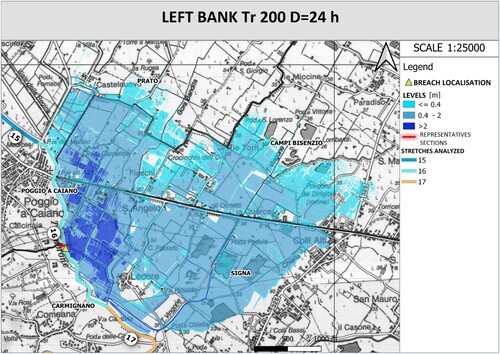
Figure 9. Structures, roads, and resident population per km2 involved by the flood simulation (data downloaded from Region of Tuscany’s website).
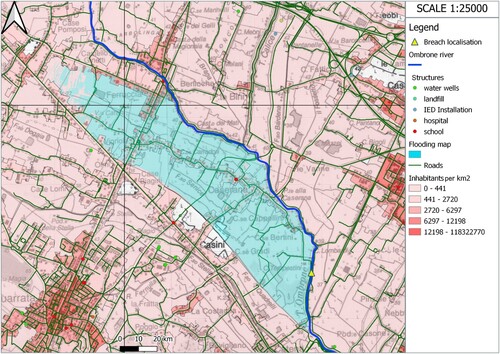
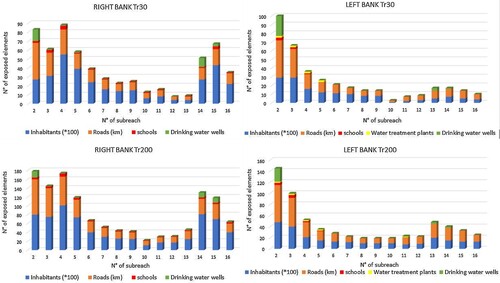
Figure 10. Summary graphs of the exposed elements number for each side bank and for each scenario: (a) right bank Tr200 years, (b) left bank Tr200 years, (c) right bank Tr30 years and (d) left bank Tr30 years.