Figures & data
Figure 1. The Three Points Approach scheme. Both the axes are on a logarithmic scale. The horizontal axis represents the flood return period and the vertical axis represents the magnitude of the rain event in terms of costs of maintenance and damage of the urban infrastructure.
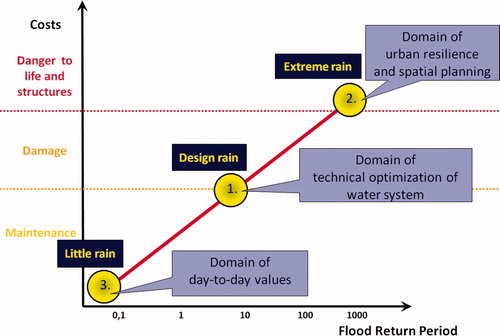
Table 1. Number of stakeholder categories and sub-categories and number of interviewees associated with them.
Table 2. 11 aspects defining the values stakeholders involved in decisions related to UFRM may assign to water infrastructure and services within the urban area. Adapted from (Lems, 2008; Dooyeweerd, 1953; Lems &Valkman, 2003; Geldof 2005)
Figure 2. A conceptual description of the urban area as context of the decision making process in UFRM. This is just a representation of the complexity characterising an urban context where the technical, social and natural systems interact. However, the characteristics of the context change from project to project and from location to location.
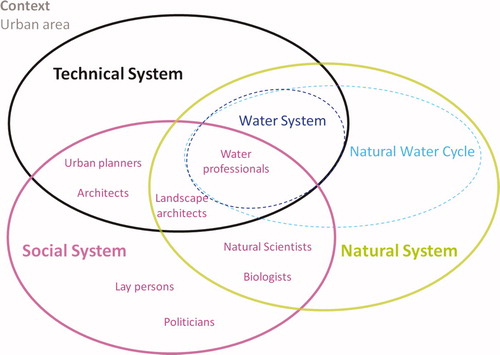
Table 3. Overview of the key stakeholder categories identified in the analysed case studies and the aspects they prioritised during the interviews.
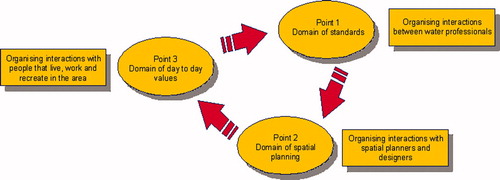
Figure 3. The iterative process of UFRM when using the 3PA. The boxes list (non-exclusively) the main stakeholders that are important to include in the three domain discussions.