Figures & data
Table 1. Assumptions, calculations and references for mass and volume balances in the actual state if not otherwise stated.
Figure 1. Mass and volume balances for the actual state (0% transition) of a conventional WWTP, with: PC = primary clarifier; DN = denitrification stage; SC = secondary clarifier; ST = sewage sludge thickener; DGT = digester; FP = chamber filter press (for sewage sludge dewatering); PS = primary sludge; ES = excess sludge; RS = raw sludge; DS = digested sludge; SL = sludge liquor (chargeback).
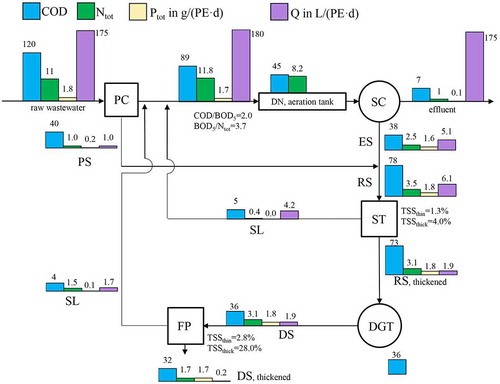
Figure 2. Mass and volume balances for 35% blackwater separation (e.g. 35,000 PE out of 100,000 PE) of a conventional WWTP undergoing transition to new sanitation technologies, with: BW = blackwater; BT = blackwater thickener, cf. Figure 1 for remaining legends.
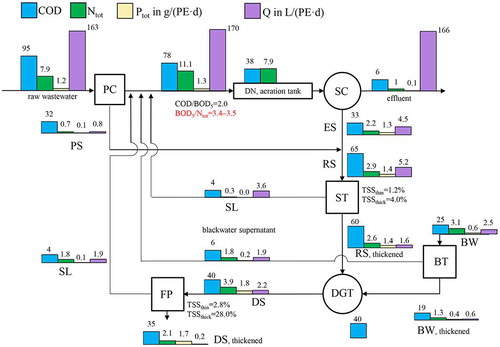
Figure 3. Mass and volume balances for 75% blackwater separation (e.g. 75,000 PE out of 100,000 PE) of a conventional WWTP undergoing transition to new sanitation technologies, with: BW = blackwater; BT = blackwater thickener; N = nitrogen recovery, cf. Figure 1for remaining legends.
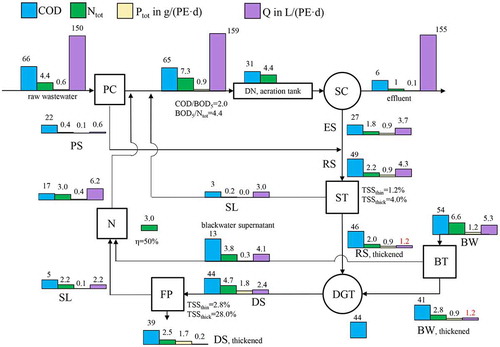
Table 2. Transitions states with respective tipping points for plant operation and corrective measures to overcome operating problems.
Figure 4. Expected developments of power demand for aeration and power generation from biogas in a conventional WWTP for cases one and two.
Figure 5. Total nitrogen recovery potential and recovery ratesFootnote 1 at two different recovery efficiencies.
Figure 6. Total phosphorus recovery potential and recovery ratesFootnote 2 at two different recovery efficiencies.