Figures & data
Figure 1. Flow chart of the method.
Figure 2. Scheme of the cases of study: a) Sys473, b) Sys365, c) Sys47 and d) Sys40.
Figure 3. Pareto fronts obtained using Deterministic Optimization (DO) and Robust Optimization (RO), for different networks.
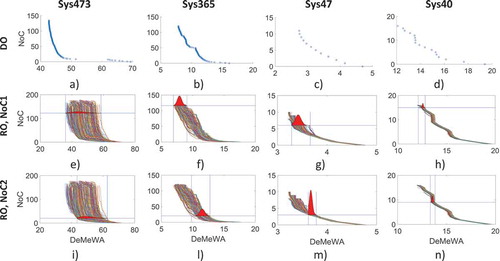
Table 1. Metadata of the distribution systems.
Figure 4. Reliability and frequency of unique solutions.
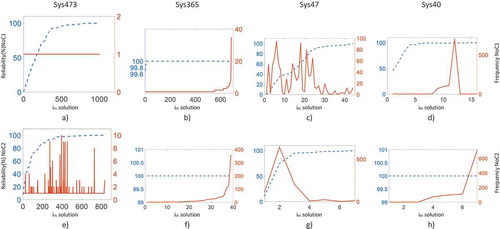
Figure 5. Comparison among ROS1 (R1), ROS2 (R2), DOS (D), and the rest of the reliable solutions for all the cases.
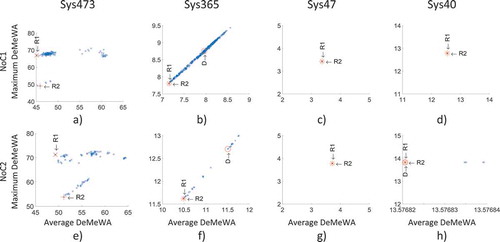
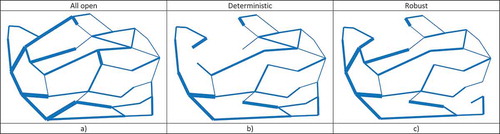
Figure 6. Network Sys47, all pipes open (a), and optimum solutions closing six pipes (i.e. NoC1), deterministic (b) and robust (c).