Figures & data
Figure 1. Maps of the study area: left-hand map shows the location of Kampala, Uganda in Africa (Google) and right-hand map shows the districts within Greater Kampala Metropolitan area, including demarcation of population levels and type of sanitation system. The central Division of Kampala is largely sewered (striped area), while parts of Rubaga, Makindye, Nakawa, and Kawempe Divisions are sewered although a majority still use on-site systems (dotted areas). The remaining areas are served by septic tanks and pit latrines, with a strong predominance for pit latrines. Data source: Uganda Bureau of Statistics (http://ubos.geo-solutions.it). Accessed 2019-09-10.
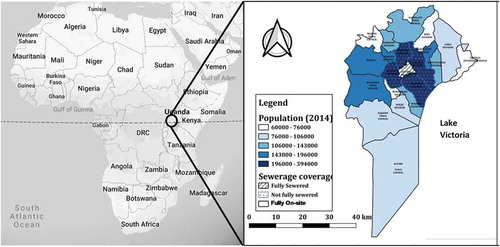
Figure 2. Simplified fecal flow diagram for the Greater Kampala region, based on data from Kampala Sanitation Master Plan (2015), and assessments made by Schoebitz, Niwagaba, and Strande (Citation2016) and Niwagaba (Citationn.d.).
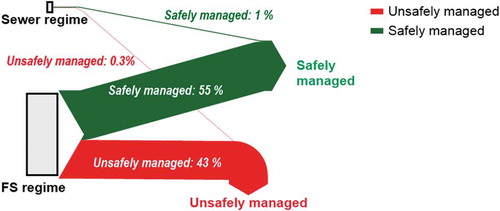
Table 1. Annualized capital and operating costs for the centralized and on-site sanitation regimes in Greater Kampala, Uganda. Costs are broken down by stakeholder and service along the service chain.*
Table 2. Comparison of costs and households’ share of costs for the sewage and fecal sludge (FS) regimes, presented as the ratios of costs between regimes and percentage of costs paid by households (derived from values shown in ).
Figure 3. Annualized capital and operating costs for the (left) centralized sewage regime and (right) on-site fecal sludge regime in Greater Kampala, Uganda. Note that some cost items are too small to be shown in the diagram (see for exact values).
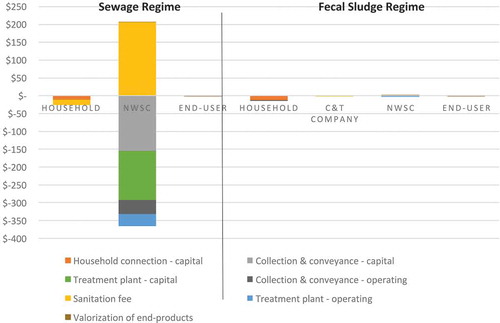
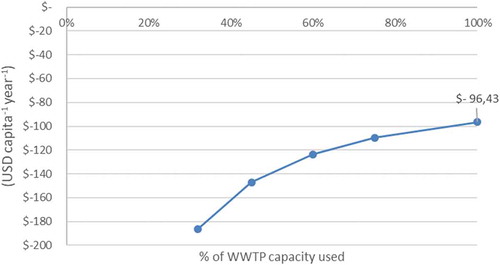
Figure 4. Changes in total annualized capital and operating costs in the sewage regime based on increasing the number of people connected to the system to the maximum capacity of existing wastewater treatment plants (WWTPs), while keeping the ratio of domestic to non-domestic customers the same (i.e. 16% domestic).
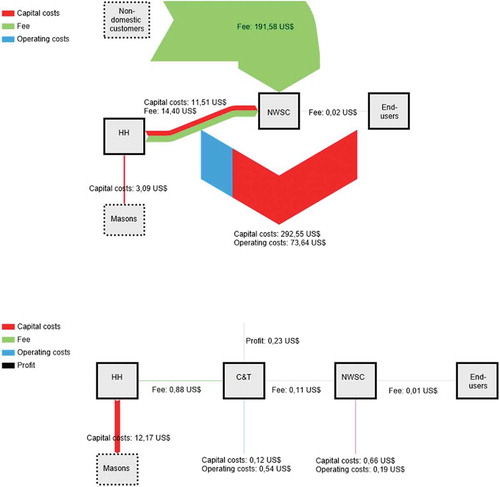
Figure 5. Financial flows between stakeholders in the (top) centralized sewage regime and (bottom) on-site fecal sludge regime. The size of the arrows is proportionate to the financial flow in question. The dashed lines represent stakeholders not included in this study.