
Figures & data
Figure 1. Scheme of water demand forecasting process.
Figure 2. Map of DMA sectors. Sectors included in this study are marked with turquoise colour.
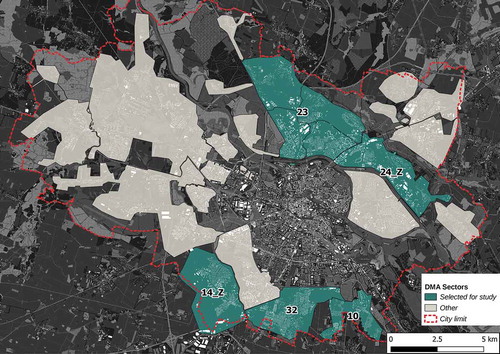
Figure 3. Correlation of geolocated data and water usage time-series in DMA 24_Z: (a) series comparison after applying offset and decay parameters. (b) correlation depending on the decay parameter for each DMA. Depicted correlations are calculated for the best offset parameter.
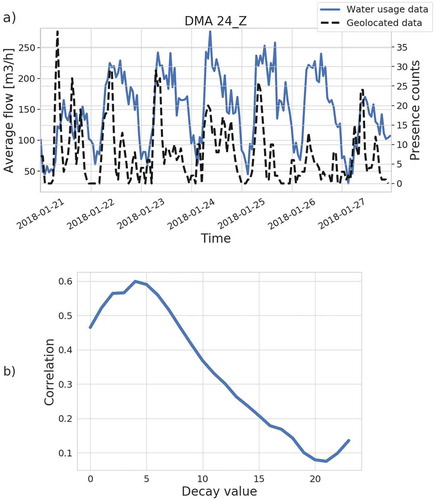
Table 1. Calculated average MAPE, RMSE and EI for 7-days ahead forecast for all the DMAs with respect to the methods and variants.
Table 2. Calculated average MAPE, RMSE and EI MAPE for 24-hours ahead forecast for all the DMAs with respect to the methods and variants.
Table 3. Averaged share of significant correlation values in the autocorrelation function for 7-days and 24-hours ahead forecasts for all the DMAs with respect to the methods and variants.