Figures & data
Table 1. Traditional self-cleansing models used to evaluate the bedload sediment transport in sewer pipes.
Figure 1. Experimental apparatus used to collect bedload sediment transport data.
Figure 2. Grading curve of material used on experimental setup.
Table 2. Bedload experiments in the 242 mm acrylic pipe.
Table 3. Dataset used to evaluate the performance of self-cleansing models.
Table 4. Optimization strategies adopted to derive new self-cleansing models.
Table 5. Models obtained using EPR for different optimization strategies.
Table 6. Performance of models returned by EPR-MOGA-XL and literature self-cleansing models/equations. Bolded values show best performing models.
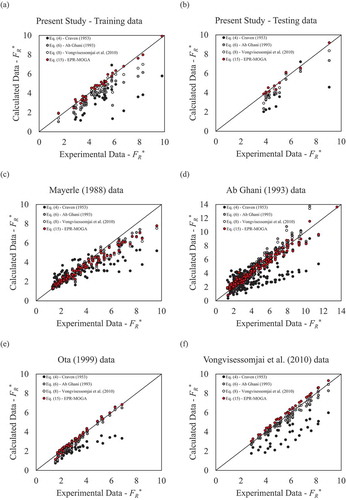
Figure 3. Fitting of traditional equations and EPR-MOGA models, using (a) Present study training data; (b) Present study testing data; (c) Mayerle (Citation1988) data; (d) Ab Ghani (Citation1993) data; (e) Ota (Citation1999) data and (f) Vongvisessomjai, Tingsanchali, and Babel (Citation2010) data.