Figures & data
Figure 1. Stages and phases considered in the system boundaries
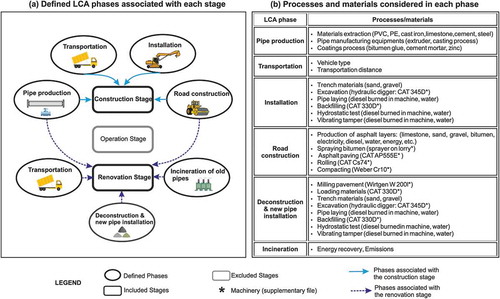
Table 1. Environmental indicators of different phases in the construction stage (1 m of WDN, design pressure = 10 bar)
Figure 2. Environmental impacts for 1 m of WDN construction (design pressure of 10 bar)
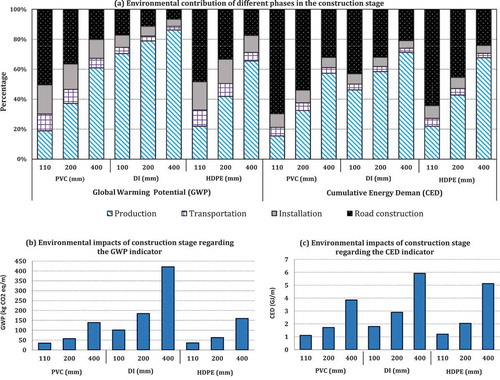
Figure 3. Contribution of each process in terms of the GWP indicator for construction of 1 m of WDN (impacts > 4% of total effects) with: (a) HDPE 200 mm, (b) DI 200 mm
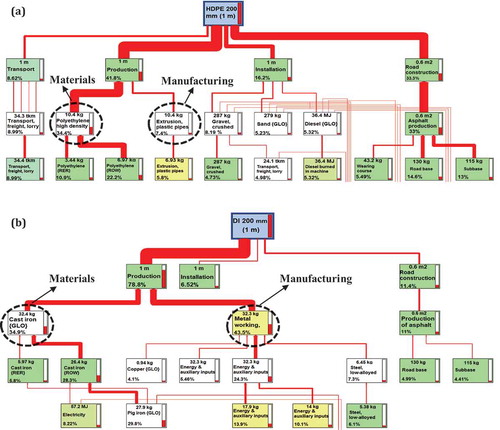
Figure 4. Environmental impacts for 1 m of WDN renovation (design pressure of 10 bar)
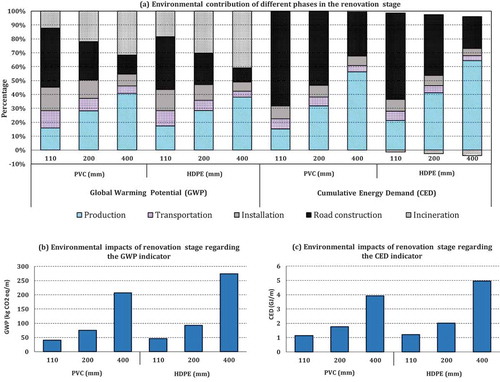
Figure 5. Monte Carlo simulations for comparing the environmental impacts of the construction and renovation stages
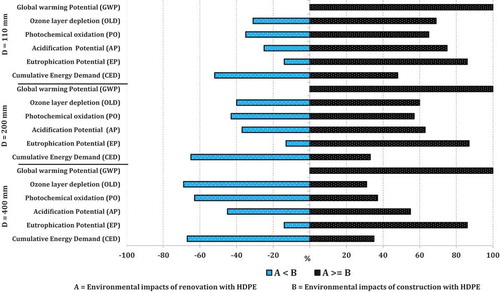
Figure 6. Influence of the life spans of different pipe materials on environmental impacts
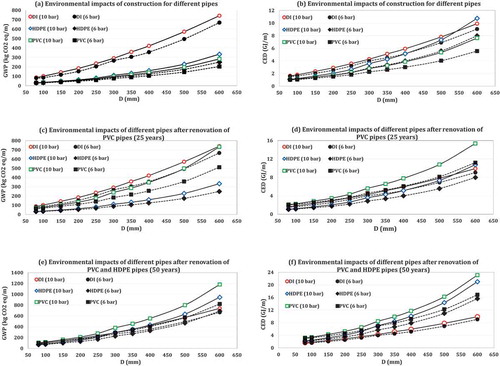
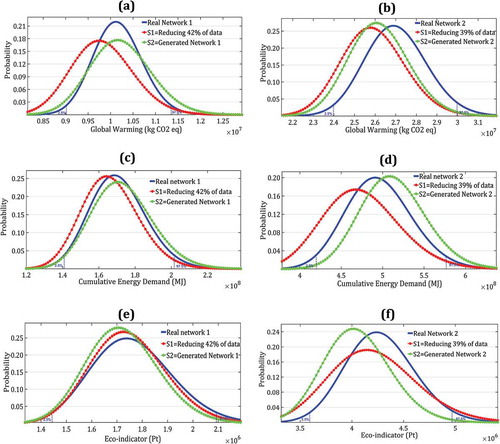
Figure 7. Probability distribution of case studies associated with GWP, CED, and Eco-indicator