Figures & data
Table 1. Historical water quality parameter averages at the water treatment works, service reservoir outlet and the district-metered area served for the period from 2007 to 2010 at site A
Table 2. Historical water quality parameter averages at the water treatment works, service reservoir outlet and the district-metered area served for the period from 2008 to 2019 at site B
Figure 1. A box and whisker plot showing total iron concentrations in mg/l at the outlet of water treatment works, and inlet and outlet of the supplied service reservoir (site A) across 2018. The thick horizontal bar indicates the median, the top and bottom of the box indicate the interquartile range and the whiskers represent the spread of data outside of this interquartile range
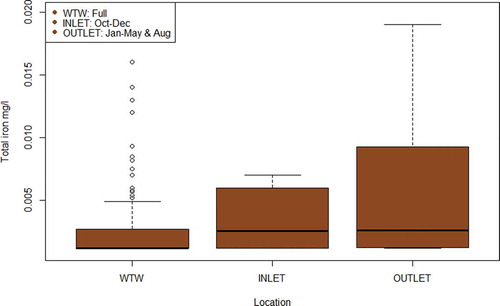
Figure 2. A box and whisker plot showing total manganese concentrations in mg/l at the outlet of water treatment works, and inlet and outlet of the supplied service reservoir (site A) across 2018. The thick horizontal bar indicates the median, the top and bottom of the box indicate the interquartile range and the whiskers represent the spread of data outside of this interquartile range
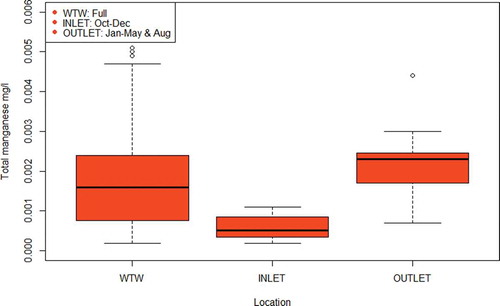
Figure 3. 10-point moving average values for turbidity at the inlet and outlet of the service reservoir (site B) at one-minute intervals
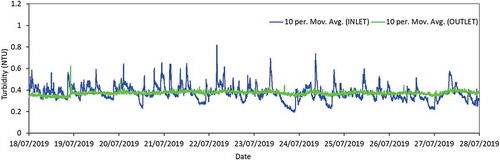
Figure 4. Inlet turbidity values (NTU) at one-minute intervals and hourly inlet total iron concentrations (mg/l) for the 24-hour sampling campaign at site B
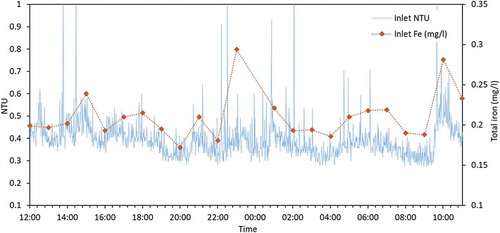
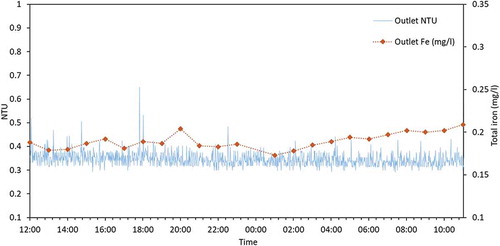
Figure 5. Outlet turbidity values (NTU) at one-minute intervals and hourly outlet total iron concentrations (mg/l) for the 24-hour sampling campaign at site B