
Figures & data
Figure 1. (a) Measurement device for the sediment bed depth; (b) Gully pot; (c) Side view of sediment bed depth measurement in gully pot.
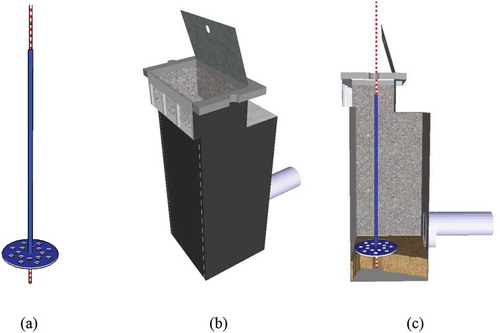
Table 1. Model parameters.
Table 2. Type of relations between the parameters and the accumulation rate in gully pots. Positive correlations are denoted with a plus sign and negative correlations with a minus sign.
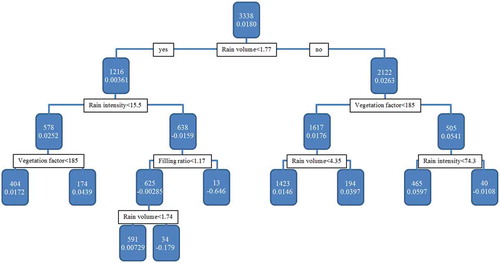
Figure 3. RT for dataset 1. The values at the nodes are the number of observations in the group and the mean accumulation rate of the group.
Figure 2. Sediment bed depth development over time in 4 gully pots, which restarts after cleaning.
Supplemental material