Figures & data
Table 1. Characterization of pipes and flow in the case study
Figure 1. Case study scheme
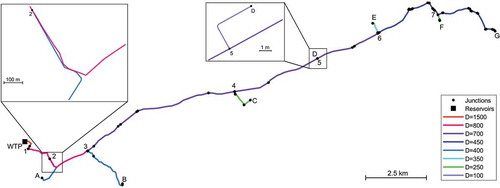
Figure 2. Bulk decay model (2 R) fitting to bottle test results
Figure 3. Correlation plot for the bulk decay model (2 R)
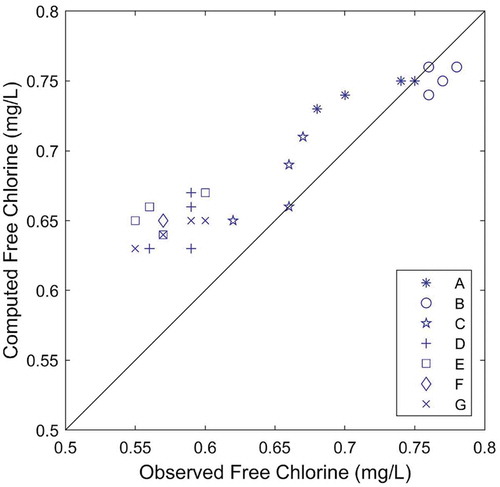
Figure 4. Average chlorine consumption in the system (from the inlet to each monitored node) and percentage of wall decay to overall chlorine demand
Figure 5. Correlation plots for the (a) EXPBIO and the (b) FO models
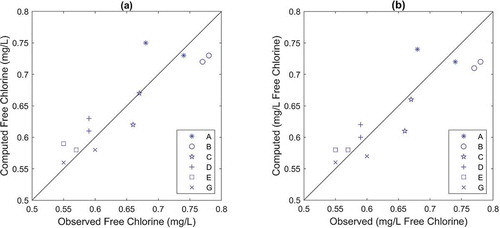
Figure 6. Measured and simulated chlorine concentration over time at node D by FO and EXPBIO models
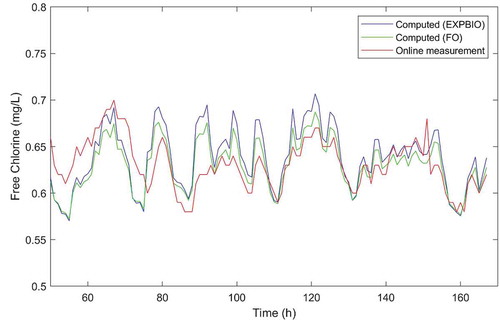
Figure 7. Correlation plots for EXPBIO model when parameters A and B vary by a factor of 10
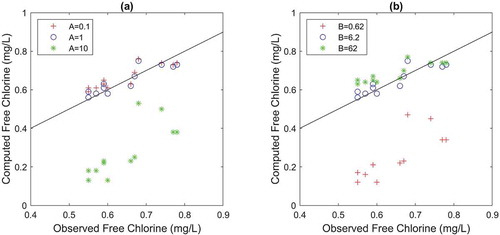
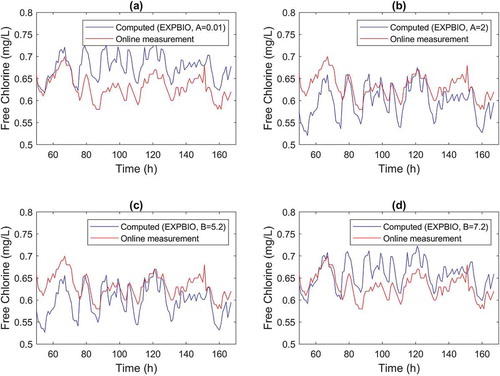
Figure 8. EXPBIO model predictions for node D by (a) decreasing A to 0.01 dm/h, (b) increasing A to 2 dm/h, (c) decreasing B to 5.2 L/mg and (d) increasing B to 7.2 L/mg