Figures & data
Figure 1. Overview of proposed methodology
Figure 2. Absolute maximum theoretical performance mass balance
Figure 3. Layout of the UDS upstream of the pumping station
Figure 4. Example of reduced pumping capacity leading to a CSO upstream
Figure 5. Rainfall characteristics of a single pixel for the events used in the assessment of the RTC procedure. (a) distribution of total depth and intensity and (b) comparison to rainfall return periods
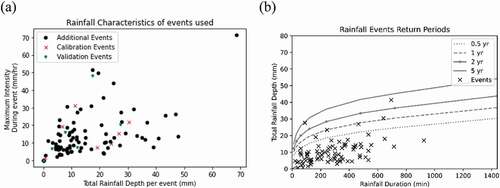
Table 1. Overview of tested RTC procedure
Table 2. Flow phases used for RTC procedures 1 and 2
Figure 6. NSE performance of the monitoring locations
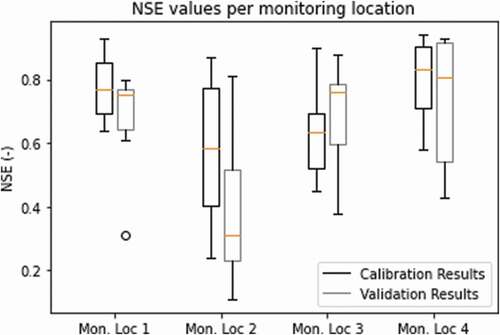
Figure 7. (a-d) Validation results for single event during calibration process for Monitoring Loc 1 (a), 2(b), 3 (c) and 4 (d)
Table 3. Performance overview of RTC procedures
Figure 8. Objective comparison of RTC procedures to pre-RTC and generalised baseline
Figure 9. Distribution of RPIs for the RTC strategies. Whiskers are the 95 CIs
Figure 10. Relation between mean total rainfall of an event and RPIa